Sequential Enrichment Designs for Early Phase Clinical Trials (Reproducing Results)
This post reproduces the results from the presentation Sequential Enrichment Designs for Early Phase Clinical Trials.
Background
Study objective
- PoC study of Drug A to evaluate its anti-tumor activity in gastric cancer
Endpoint
- Objective response rate (ORR) Study population
- All patients irrespective of status for biomarker of interest Y
Study design
- Single-arm with biomarker of interest Y
Dual Criteria Design
- Formal inclusion of statistical significance and clinical relevance in design:
- Decide GO
- Strong evidence: effect ≥ no effect or null value (NV)
- Estimated effect ≥ decision value (DV)
- DV : minimum effect with clinical relevance; not classical alternative hypothesis
- Need discussion with nonstatisticians
- Sample size requires consideration of DV
- Adequate sample size is required to ensure statistical significance when clinical relevance observed
- Need simulation to calculate design operating characteristics (e.g., type-I error, power)
Subpopulation Selection in Early Phase
Demand for a new design
- A competitor Drug B failed for all-comers but show promising efficacy in patients with Y+ in post-hoc subgroup analysis
Goal
- Assess activity of Drug A for all patients irrespective of biomarker status
- If it is not active for all patients, assess activity of Drug A for Y+ patients
Single-stage Design with Population Selection
Brief Description
Study populations All-comers (F) = Y+ patients + Y- patients
Bayesian triplet criterion for all-comers
- Pr(ORR (F) ≥ 16% | data) ≥ 0.975
- Posterior median (F) ≥ 24%
- Pr(ORR (Y-) ≥ 16% | data) ≥ 0.75 (activity assurance in Y- patients)
The third criteria ensures that the effect of Drug A in F is not solely driven by Y+
- Bayesian dual criteria for Y+ patients
- Pr(ORR (Y+) ≥ 16% | data) ≥ 0.95
- Posterior median (Y+) ≥ 24%
- Minimum sample size (SSmin) All-comers: 87 (with number of responders ≥21) Y+ patients: 58 (with number of responders ≥14)
Sample size bigger than SSmin ensures statistical significance when clinical relevance is observed
Figure 1: Flow Chart for Single-stage Enrichment Design
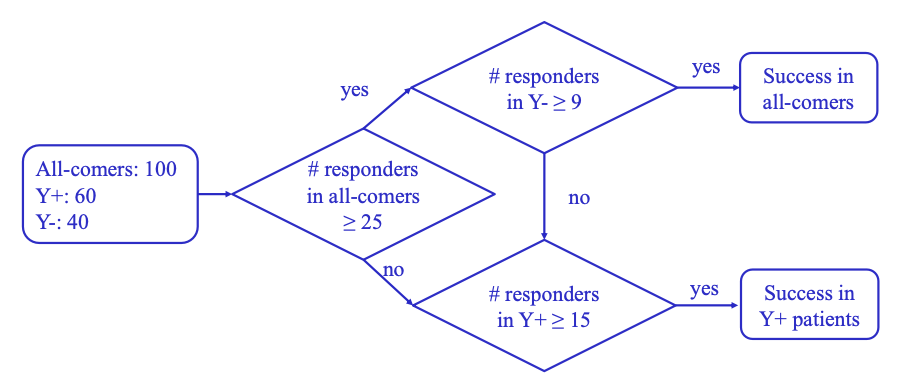
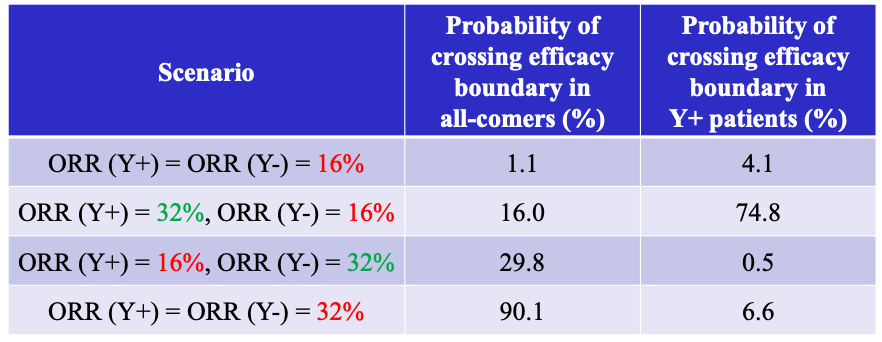
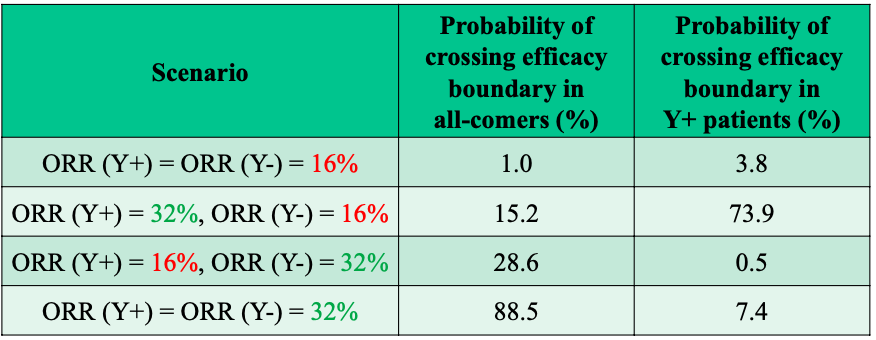
Figure 2: OC for One-stage Enrichment Design
Main Body of R Code
#######################################################################
#
# Pfizer- One Stage Enrichment Designs for Early Phase Clinical Trials
#
#######################################################################

library(dplyr)
library(ggplot2)
library(Rcpp)
library(stargazer) # 给txt输出排版用的包

start_time <- Sys.time()

#-*-*-*-*-*-*-*-*-*-*-*-*-*-*-*-*-*-*-*-*-*-*-*-*
# 0: 导入计算后验的c++外部函数
#-*-*-*-*-*-*-*-*-*-*-*-*-*-*-*-*-*-*-*-*-*-*-*-*

sourceCpp('function_cpp.cpp')

#-*-*-*-*-*-*-*-*-*-*-*-*-*-*-*-*-*-*-*-*-*-*-*-*
# 主程序1: 寻找Minimum sample size - Figure 1
#-*-*-*-*-*-*-*-*-*-*-*-*-*-*-*-*-*-*-*-*-*-*-*-*

nv = 0.16
statsig = 0.975
clinicalsig = 0.75
postmed = 0.24
positivestatsig = 0.95
maxsamplesize = 110 #我们能接受的样本量的上限,但是设太低可能会找不到
samplesize_start = 30 #实际应用中,总不可能样本量从1开始的
maxresponse = 25 #实际应用中可能出现的最高的responders数量?

beta_a = 0.1904762 #先验变化会对minimum sample size有影响,就算是无信息先验
beta_b = 1

totalrow = (maxsamplesize-samplesize_start+1)*(maxresponse)

df <- as.data.frame(responsegate(maxresponse = maxresponse,
                   samplesizestart = samplesize_start,
                   maxsamplesize = maxsamplesize,
                   a = beta_a,
                   b = beta_b,
                   nv = nv,
                   positivestatsig = positivestatsig,
                   statsig = statsig,
                   postmed = postmed))

colnames(df) <- c("r","n","significance","postmedian","justmedfl","bothfl","tripfl","group")

# 删去不满足任何标准的行记录
df_cc <- filter(df,justmedfl==1 | bothfl==1 | tripfl==1)

# recode
df_cc <- df_cc %>%
  mutate(group=recode(group,'2'="full",'3'="positive only",'4'="n/a"))

## 最小样本量逻辑:按照n分组,找到最小的那个significance,因为一旦满足当前的要求,
## 则对于这个n,比当前significance对应的r更大的r,它的significance肯定更高

df_cc_plot <- df_cc %>%
  group_by(n) %>%
  slice(which.min(significance))

# 可视化最小样本量
text_y <- min(df_cc_plot$significance)+0.002
min_y <- min(df_cc_plot$significance)
max_y <- max(df_cc_plot$significance)

p <- ggplot(data=df_cc_plot, mapping = aes(x=n,y=significance)) +
  geom_point(aes(color = factor(group)), size = 2, shape=17) +
  geom_hline(yintercept=positivestatsig, linetype="dashed", color = "orange") +
  geom_hline(yintercept=statsig, linetype="dashed", color = "orange") +
  geom_vline(xintercept=58, linetype="dashed", color = "black") +
  geom_vline(xintercept=87, linetype="dashed", color = "black") +
  annotate(geom="text", x=58+7, y=text_y, label= "r/n=15/58") +
  annotate(geom="text", x=87+7, y=text_y, label= "r/n=22/87") +
  scale_y_continuous(name="Statistical Significance", limits=c(min_y, max_y))+
  labs(color="Group") +
  theme_classic()
p

#-*-*-*-*-*-*-*-*-*-*-*-*-*-*-*-*-*-*-*-*-*-*-*-*
# 主程序2: 评估设计的OC
#-*-*-*-*-*-*-*-*-*-*-*-*-*-*-*-*-*-*-*-*-*-*-*-*

allcomers = 100
y_plus = 60
y_minus = allcomers-y_plus

# 基于100人总样本量,60人Y+,40人Y-,去数据集df_cc_plot里寻找对应的responder gate
responder_gate <- df_cc_plot %>%
  filter(n == allcomers | n==y_plus | n==y_minus) %>%
  select(c(r,n))

full_gate <- responder_gate[which(responder_gate$n==allcomers),1]$r
y_plus_gate <- responder_gate[which(responder_gate$n==y_plus),1]$r

# Y-的responders
Y_minus_significance <- 0.75

y_minus_dec <- df %>% filter(n==y_minus & significance>=Y_minus_significance)

y_minus_dec2 <- y_minus_dec %>%
  slice(which.min(r))
y_minus_gate <- y_minus_dec2$r

# 不同场景的orr假设
## 1
orr_plus_1 <- 0.16
orr_minus_1 <- 0.16
## 2
orr_plus_2 <- 0.32
orr_minus_2 <- 0.16
## 3
orr_plus_3 <- 0.16
orr_minus_3 <- 0.32
## 4
orr_plus_4 <- 0.32
orr_minus_4 <- 0.32

simoc <- function(orr_plus,
                  orr_minus,
                  allcomers,
                  y_plus,
                  y_minus,
                  full_gate,
                  y_plus_gate,
                  y_minus_gate,
                  rep){

  # 初始化模拟矩阵
  simmat <- data.frame(orr_plus=rep(NA,rep),
                   orr_minus=rep(NA,rep),
                   allcomers=rep(NA,rep),
                   y_plus=rep(NA,rep),
                   y_minus=rep(NA,rep),
                   full_gate=rep(NA,rep),
                   y_plus_gate=rep(NA,rep),
                   y_plus_responders=rep(NA,rep),
                   full_responders=rep(NA,rep),
                   succ_full=rep(FALSE,rep),
                   succ_y_pos=rep(FALSE,rep))

  for (row in 1:rep){
    resp_y_plus <- sum(rbinom(y_plus,1,orr_plus))
    resp_y_minus <- sum(rbinom(y_minus,1,orr_minus))
    total_resp <- resp_y_minus+resp_y_plus

    #决策 - 怎么避免重复书写? if 太多了
    if (total_resp >= full_gate){
      if (resp_y_minus >= y_minus_gate){
        simmat[row,"succ_full"] <- TRUE
      } else {
        if (resp_y_plus >= y_plus_gate){
          simmat[row,"succ_y_pos"] <- TRUE
        }
      }
    } else{
      if (resp_y_plus >= y_plus_gate){
        simmat[row,"succ_y_pos"] <- TRUE
      }
    }

    # simmat赋值
    simmat[row,"orr_plus"] <- orr_plus
      simmat[row,"orr_minus"] <- orr_minus
      simmat[row,"allcomers"] <- allcomers
      simmat[row,"y_plus"] <- y_plus
      simmat[row,"y_minus"] <- y_minus
      simmat[row,"full_gate"] <- full_gate
      simmat[row,"y_plus_gate"] <- y_plus_gate
      simmat[row,"y_plus_responders"] <- resp_y_plus
      simmat[row,"full_responders"] <- total_resp
  }

  return(simmat)
}

rep = 12000

scen1 <- simoc(orr_plus_1,
               orr_minus_1,
               allcomers,
               y_plus,
               y_minus,
               full_gate,
               y_plus_gate,
               y_minus_gate,
               rep)

scen2 <- simoc(orr_plus_2,
               orr_minus_2,
               allcomers,
               y_plus,
               y_minus,
               full_gate,
               y_plus_gate,
               y_minus_gate,
               rep)

scen3 <- simoc(orr_plus_3,
               orr_minus_3,
               allcomers,
               y_plus,
               y_minus,
               full_gate,
               y_plus_gate,
               y_minus_gate,
               rep)

scen4 <- simoc(orr_plus_4,
               orr_minus_4,
               allcomers,
               y_plus,
               y_minus,
               full_gate,
               y_plus_gate,
               y_minus_gate,
               rep)

# 汇报结果 - 与壁报的Figure 6.2 OC for One stage Enrichment Design 对比
result <- data.frame(scenario=rep(NA,4),
                     prob_eff_full=rep(NA,4),
                     prob_eff_positive=rep(NA,4))

result[1,"scenario"] <- "ORR (Y+) = ORR (Y-) = 16%"
result[2,"scenario"] <- "ORR (Y+) = 32%, ORR (Y-) = 16%"
result[3,"scenario"] <- "ORR (Y+) = 16%, ORR (Y-) = 32%"
result[4,"scenario"] <- "ORR (Y+) = ORR (Y-) = 32%"


result[1,"prob_eff_full"] <- mean(scen1$succ_full)*100
result[2,"prob_eff_full"] <- mean(scen2$succ_full)*100
result[3,"prob_eff_full"] <- mean(scen3$succ_full)*100
result[4,"prob_eff_full"] <- mean(scen4$succ_full)*100

result[1,"prob_eff_positive"] <- mean(scen1$succ_y_pos)*100
result[2,"prob_eff_positive"] <- mean(scen2$succ_y_pos)*100
result[3,"prob_eff_positive"] <- mean(scen3$succ_y_pos)*100
result[4,"prob_eff_positive"] <- mean(scen4$succ_y_pos)*100

# 评估程序运行时间
end_time <- Sys.time()
end_time-start_time

# 输出TXT
stargazer(result,
          title = "OC for One stage Enrichment Design",
          summary = FALSE,
          rownames = FALSE,
          type = "text",
          align = TRUE,
          out = "单阶段富集设计OC.txt",
          notes = paste0("程序运行用时",as.character.Date(end_time-start_time),", 可对比辉瑞壁报Figure 6.2"),
          notes.align = "l")
Utility Function
#include <Rcpp.h>
using namespace Rcpp;

// [[Rcpp::export]]
NumericVector responsegate(int maxresponse,int samplesizestart,int maxsamplesize,double a,double b,double nv,double positivestatsig,double statsig,double postmed){
  // Creating object
  int row,totalrow,f1,f2,f3;
  double med,sig;
  totalrow = (maxsamplesize-samplesizestart+1)*(maxresponse);
  NumericMatrix df(totalrow,8);
  row = 0;
  // using loop to construct response matrix
  for(int r = 1; r <= maxresponse; ++r) {
    for(int n = samplesizestart; n <= maxsamplesize; ++n) {
      // generate beta random numbers
      NumericVector rand = Rcpp::rbeta( 100000, a+r, b+n-r);
      // compare to nv
      LogicalVector logicnv = rand >= nv;
      sig= mean(logicnv);
      med = median(rand);
      // output
      df(row,0) = r;
      df(row,1) = n;
      df(row,2)=sig;
      df(row,3)=med;
      // decision flag
      f1=0;
      f2=0;
      f3=0;
      if (sig<positivestatsig && med>=postmed){
        df(row,4)=1;
        f1=1;
        };
      if (sig>=positivestatsig && med>=postmed && sig<statsig){
        df(row,5)=1;
        f2=1;
        };
      if (sig>=statsig && med>=postmed){
        df(row,6)=1;
        f3=1;
        };
      // 2-full,3-positive only,4-n/a
      if (f3==1){
        df(row,7) = 2;
      } else if(f2==1){
        df(row,7) = 3;
      } else if (f1==1){
        df(row,7) = 4;
      }
      row++;
    }
  }
  return df;
}
OC
OC for One stage Enrichment Design
==============================================================
           scenario            prob_eff_full prob_eff_positive
--------------------------------------------------------------
  ORR (Y+) = ORR (Y-) = 16%        0.983           4.067
ORR (Y+) = 32%, ORR (Y-) = 16%    16.150          74.242
ORR (Y+) = 16%, ORR (Y-) = 32%    29.567           0.467
  ORR (Y+) = ORR (Y-) = 32%       90.350           6.158
--------------------------------------------------------------
程序运行用时1.095885 mins, 可对比辉瑞壁报Figure 6.2
Two-stage Design with Adaptive Population Enrichment
Brief Description
- Sequential enrichment
- Use probability of success (POS) at interim to allow early stopping for futility.
- Use POS for interim decision making
- POS(F): PP(posterior median (F) ≥ 24% at final analysis | interim data); PP=predictive probability
- POS(Y+): PP(posterior median (Y+) ≥ 24% at final analysis | interim data)
- POS(Y-): PP (Pr(ORR (Y-) ≥ 16% | data) ≥ 0.75 at final analysis | interim data)
- Interim decision rules
- Continue with F: POS(F) ≥ 10% and POS(Y-) ≥ 10%
- Continue with Y+: POS(F) ≥ 10% but POS(Y-) < 10% and POS(Y+) ≥ 10% OR
- POS(F) < 10% but POS(Y+) ≥ 10%
Otherwise stop for futility.
Figure 3: Flow Chart for Sequential Enrichment Design
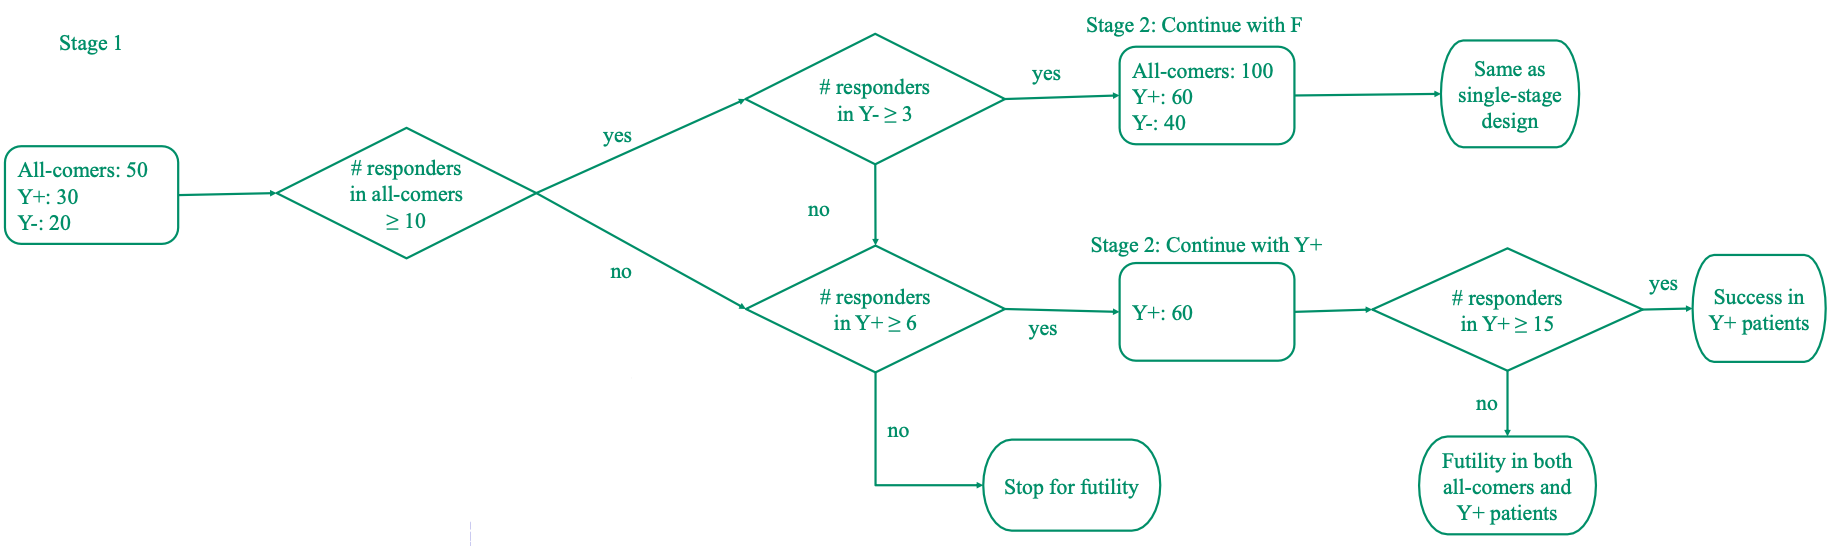
Figure 4: Interim OC for Sequential Enrichment Design
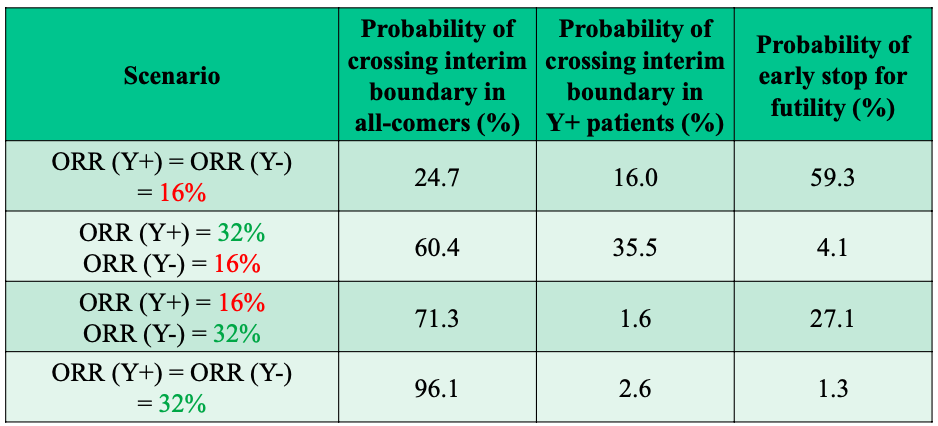
Figure 5: Final OC for Sequential Enrichment Design
Main Body of R Code
#######################################################################
#
# Pfizer- Sequential Enrichment Designs for Early Phase Clinical Trials
#
#######################################################################

library(dplyr)
library(ggplot2)
library(Rcpp)
library(reshape2)
library(stargazer) # 给txt输出排版用的包

start_time <- Sys.time()

#-*-*-*-*-*-*-*-*-*-*-*-*-*-*-*-*-*-*-*-*-*-*-*-*
# 0: 导入计算后验的c++外部函数
#-*-*-*-*-*-*-*-*-*-*-*-*-*-*-*-*-*-*-*-*-*-*-*-*

sourceCpp('function_cpp.cpp')
sourceCpp('predprobMedian.cpp')
sourceCpp('predprobPosterior.cpp')

#-*-*-*-*-*-*-*-*-*-*-*-*-*-*-*-*-*-*-*-*-*-*-*-*
# 主程序1: 寻找中期分析的决策边界
#-*-*-*-*-*-*-*-*-*-*-*-*-*-*-*-*-*-*-*-*-*-*-*-*

# 先验
beta_a = 0.1904762 #a/a+b=0.16倒推,先验变化会对minimum sample size有影响,就算是无信息先验
beta_b = 1

# 双标准决策中的边界
postmed = 0.24
nv = 0.16
clinicalsig = 0.75
pp_thres = 0.1

# 搜索的responders上限
max_responders <- 20

# 第一阶段full人群的样本量和final阶段full人群样本量,用来算PP
full_n1 <- 50
full_n_total <- 100
# 第一阶段Y+人群的样本量和final阶段Y+人群样本量,用来算PP
y_plus_n1 <- 30
y_plus_n_total <- 60
# 第一阶段Y-人群的样本量和final阶段Y-人群样本量,用来算PP
y_minus_n1 <- 20
y_minus_n_total <- 40

# 设置向量来收集full/Y+/Y-在期中的时候PP的结果
r_vec <- seq(1,max_responders,1)
full_succ_vec <- rep(NA,max_responders)
y_minus_succ_vec <- rep(NA,max_responders)
y_plus_succ_vec <- rep(NA,max_responders)

for (r in 0:max_responders){
  full_pp <- predprobMedian(r,full_n1,full_n_total,beta_a,beta_b,postmed)
  y_minus_pp <- predprobPosterior(r,y_minus_n1,y_minus_n_total,beta_a,beta_b,nv,clinicalsig)
  y_plus_pp <- predprobMedian(r,y_plus_n1,y_plus_n_total,beta_a,beta_b,postmed)

  # collect result
  full_succ_vec[r] <- full_pp
  y_minus_succ_vec[r] <- y_minus_pp
  y_plus_succ_vec[r] <- y_plus_pp

  # package result
  result_df <- data.frame(r=r_vec,
                          fullpp=full_succ_vec,
                          yminuspp=y_minus_succ_vec,
                          ypluspp=y_plus_succ_vec)
}

result_df_t <- melt(result_df,id.vars = "r",variable.name = "population_pp")
result_df_t <- result_df_t %>% filter(!is.na(value))

p <- ggplot(data=result_df_t, mapping = aes(x=r,y=value)) +
  geom_point(aes(color = factor(population_pp), shape=factor(population_pp)), size = 3) +
  geom_hline(yintercept=clinicalsig, linetype="dotted", color = "orange",lwd=1) +
  geom_hline(yintercept=pp_thres, linetype="dotted", color = "orange",lwd=1) +
  # geom_vline(xintercept=58, linetype="dashed", color = "black") +
  # geom_vline(xintercept=87, linetype="dashed", color = "black") +
  scale_y_continuous(name="Predictive Probability")+
  scale_x_continuous(name="#responders",breaks = seq(1,max_responders,1))+
  labs(color="Group",shape="Group") +
  theme(panel.background = element_rect(fill = NA),
        panel.border = element_rect(linetype = "solid", fill = NA),
        panel.grid.major.x = element_line(colour = "grey70",linetype = "longdash"))
p

#-*-*-*-*-*-*-*-*-*-*-*-*-*-*-*-*-*-*-*-*-*-*-*-*
# 主程序1.5.1: 第一阶段的决策边界
#-*-*-*-*-*-*-*-*-*-*-*-*-*-*-*-*-*-*-*-*-*-*-*-*

# 打印决策边界
result_df_t_decision <- result_df_t %>%
  mutate(gt10=ifelse(value>0.1,TRUE,FALSE),
         gt75=ifelse(value>0.1,TRUE,FALSE))

### Continue with F:POS(F) ≥ 10% and POS(Y-) ≥ 10%,能同时满足这两个条件
### 从上面的图中可以看出,当full人群的中期条件满足(50人里观察到10个full人群responders),此时去检查y-人群,responders>=3时可以满足Full期中的决策边界
F_dec <- result_df_t_decision %>%
  filter(population_pp %in% c("fullpp","yminuspp") & value >= 0.1) %>%
  group_by(population_pp) %>%
  slice(which.min(r))
F_dec_r <- max(F_dec$r)
cat("The Go decision for full population is responders >= ",F_dec_r)

### Continue with Y+
### 从上面的图中可以看出,当full人群的中期条件满足(50人里观察到10个full人群responders),此时去检查y-人群,responders>=3时可以满足Full期中的决策边界
### condition1: 药物在full人群展示出效果,Y-无效,Y+人群有效,拓展至Y+富集
### condition2: enrichment定义,药物在full人群展示不出效果,Y+人群有效,拓展至Y+富集
y_plus_dec <- result_df %>%
  mutate(cond1 = ifelse(fullpp>=0.1 & yminuspp<0.1 & ypluspp>=0.1,TRUE,FALSE),
         cond2 = ifelse(fullpp<0.1 & ypluspp>=0.1,TRUE,FALSE),
         overall = cond1 | cond2)

y_plus_dec2 <- y_plus_dec %>%
  filter(overall == TRUE) %>%
  slice(which.min(r))

y_plus_dec_r <- max(y_plus_dec2$r)
cat("The Go decision for Y+ population is responders >= ",y_plus_dec_r)

### Continue with Y- if it continues with Full
y_minus_dec <- result_df %>%
  mutate(cond1 = ifelse(yminuspp>=0.1,TRUE,FALSE))

y_minus_dec2 <- y_minus_dec %>%
  filter(cond1 == TRUE) %>%
  slice(which.min(r))

y_minus_dec_r <- max(y_minus_dec2$r)
cat("The Go decision for Y- population is responders >= ",y_minus_dec_r)

#-*-*-*-*-*-*-*-*-*-*-*-*-*-*-*-*-*-*-*-*-*-*-*-*
# 主程序1.5.2: 第二阶段的决策边界
#-*-*-*-*-*-*-*-*-*-*-*-*-*-*-*-*-*-*-*-*-*-*-*-*

finalstage.df <- as.data.frame(responsegate(maxresponse = 30,
                                 samplesizestart = 40,
                                 maxsamplesize = 100,
                                 a = beta_a,
                                 b = beta_b,
                                 nv = nv,
                                 positivestatsig = 0.95,
                                 statsig = 0.975,
                                 postmed = postmed))
colnames(finalstage.df) <- c("r","n","significance","postmedian","justmedfl","bothfl","tripfl","group")

# 删去不满足任何标准的行记录
finalstage.df2 <- filter(finalstage.df,justmedfl==1 | bothfl==1 | tripfl==1)

# recode
finalstage.df2 <- finalstage.df2 %>%
  mutate(group=recode(group,'2'="full",'3'="positive only",'4'="n/a"))

## 最小样本量逻辑:按照n分组,找到最小的那个significance,因为一旦满足当前的要求,
## 则对于这个n,比当前significance对应的r更大的r,它的significance肯定更高

finalstage.df3 <- finalstage.df2 %>%
  group_by(n) %>%
  slice(which.min(significance))

allcomers = full_n_total
y_plus = y_plus_n_total
y_minus = allcomers-y_plus

# 基于100人总样本量,60人Y+,40人Y-,去数据集df_cc_plot里寻找对应的responder gate
responder_gate_final <- finalstage.df3 %>%
  filter(n == allcomers | n==y_plus | n==y_minus) %>%
  select(c(r,n))

full_FA_gate <- responder_gate_final[which(responder_gate_final$n==allcomers),1]$r
y_plus_FA_gate <- responder_gate_final[which(responder_gate_final$n==y_plus),1]$r

#最后阶段Y-的responder gate
y_minus_dec_final <- finalstage.df %>% filter(n==y_minus_n_total & significance>=0.75)

y_minus_dec2_final <- y_minus_dec_final %>%
  slice(which.min(r))
y_minus_FA_gate <- y_minus_dec2_final$r
#-*-*-*-*-*-*-*-*-*-*-*-*-*-*-*-*-*-*-*-*-*-*-*-*
# 主程序2: 评估设计的OC
#-*-*-*-*-*-*-*-*-*-*-*-*-*-*-*-*-*-*-*-*-*-*-*-*

# 不同场景的orr假设
## 1
orr_plus_1 <- 0.16
orr_minus_1 <- 0.16
## 2
orr_plus_2 <- 0.32
orr_minus_2 <- 0.16
## 3
orr_plus_3 <- 0.16
orr_minus_3 <- 0.32
## 4
orr_plus_4 <- 0.32
orr_minus_4 <- 0.32

# 人数假设
allcomers_ia <- full_n1
y_plus_ia <- y_plus_n1
y_minus_ia <- y_minus_n1
allcomers_overall <- full_n_total
y_plus_overall <- y_plus_n_total
y_minus_overall <- y_minus_n_total
rep <- 5000

# 设置responder threshold,从上面的试验设计中得来
full_IA_gate <- F_dec_r
full_FA_gate <- full_FA_gate

y_plus_IA_gate <- y_plus_dec_r
y_plus_FA_gate <- y_plus_FA_gate

y_minus_IA_gate <- y_minus_dec_r
y_minus_FA_gate <- y_minus_FA_gate

simseqoc <- function(orr_plus,
                  orr_minus,
                  allcomers_ia,
                  y_plus_ia,
                  y_minus_ia,
                  allcomers_overall,
                  y_plus_overall,
                  y_minus_overall,
                  full_IA_gate,
                  full_FA_gate,
                  y_plus_IA_gate,
                  y_plus_FA_gate,
                  y_minus_IA_gate,
                  y_minus_FA_gate,
                  rep){

  # 初始化模拟矩阵, s1: stage 1; s2: stage 2; overall=s1+s2
  simmat <- data.frame(orr_plus=rep(NA,rep),
                       orr_minus=rep(NA,rep),
                       allcomers_s1=rep(NA,rep),
                       y_plus_s1=rep(NA,rep),
                       y_minus_s1=rep(NA,rep),
                       allcomers_s2=rep(NA,rep),
                       y_plus_s2=rep(NA,rep),
                       y_minus_s2=rep(NA,rep),
                       full_gate_s1=rep(NA,rep),
                       y_plus_gate_s1=rep(NA,rep),
                       y_minus_gate_s1=rep(NA,rep),
                       full_gate_s2=rep(NA,rep),
                       y_plus_gate_s2=rep(NA,rep),
                       y_minus_gate_s2=rep(NA,rep),
                       y_plus_responders_s1=rep(NA,rep),
                       full_responders_s1=rep(NA,rep),
                       y_plus_responders_overall=rep(NA,rep),
                       full_responders_overall=rep(NA,rep),
                       succ_ia_full=rep(FALSE,rep),
                       succ_ia_y_pos=rep(FALSE,rep),
                       early_stop=rep(FALSE,rep),
                       succ_overall_full=rep(FALSE,rep),
                       succ_overall_y_pos=rep(FALSE,rep))

  for (row in 1:rep){

    # 产生overall样本量的随机数
    y_plus_data <- rbinom(y_plus_overall,1,orr_plus)
    y_minus_data <- rbinom(y_minus_overall,1,orr_minus)

    # 切割向量,生成中期分析数据集
    y_plus_ia_data <- y_plus_data[1:y_plus_ia]
    y_minus_ia_data <- y_minus_data[1:y_minus_ia]

    # 计算IA 及 overall分别有多少responders
    ## IA
    resp_y_plus_ia <- sum(y_plus_ia_data)
    resp_y_minus_ia <- sum(y_minus_ia_data)
    total_resp_ia <- resp_y_plus_ia+resp_y_minus_ia
    ## OVERALL
    resp_y_plus_overall <- sum(y_plus_data)
    resp_y_minus_overall <- sum(y_minus_data)
    total_resp_overall <- resp_y_plus_overall+resp_y_minus_overall

    #决策 - 怎么避免重复书写? if 太多了
    ## 先设置不同IA前进方向/最终结果判断的flag,否则IF太多了很乱
    IA_go_withF <- FALSE
    IA_go_withYPlus <- FALSE
    IA_ET <- FALSE
    SUCC_F <- FALSE
    SUCC_YPlus <- FALSE
    FA_FAIL <- FALSE
    ## S1的决策部分
    if (total_resp_ia>=full_IA_gate){
      if (resp_y_minus_ia>=y_minus_IA_gate){
        IA_go_withF <- TRUE
      } else if (resp_y_minus_ia<y_minus_IA_gate){
        if (resp_y_plus_ia>=y_plus_IA_gate){
          IA_go_withYPlus <- TRUE
        } else {
          IA_ET <- TRUE
        }
      }
    } else if (total_resp_ia<full_IA_gate){
      if (resp_y_plus_ia>=y_plus_IA_gate){
        IA_go_withYPlus <- TRUE
      } else {
        IA_ET <- TRUE
      }
    }
    ## S2的决策部分
    ### Full
    if (IA_go_withF==TRUE){
      if (total_resp_overall >= full_FA_gate){
        if (resp_y_minus_overall >= y_minus_FA_gate){
          SUCC_F <- TRUE
        } else {
          if (resp_y_plus_overall >= y_plus_FA_gate){
            SUCC_YPlus <- TRUE
          }
        }
      } else{
        if (resp_y_plus_overall >= y_plus_FA_gate){
          SUCC_YPlus <- TRUE
        }
      }
    }
    ### Y+
    if (IA_go_withF!=TRUE & IA_go_withYPlus==TRUE){
      if (resp_y_plus_overall >= y_plus_FA_gate){
        SUCC_YPlus <- TRUE
      } else {
        FA_FAIL <- TRUE
      }
    }


    # simmat赋值
    simmat[row,"orr_plus"] <- orr_plus
    simmat[row,"orr_minus"] <- orr_minus
    simmat[row,"allcomers_s1"] <- allcomers_ia
    simmat[row,"y_plus_s1"] <- y_plus_ia
    simmat[row,"y_minus_s1"] <- y_minus_ia
    simmat[row,"allcomers_s2"] <- allcomers_overall
    simmat[row,"y_plus_s2"] <- y_plus_overall
    simmat[row,"y_minus_s2"] <- y_minus_ia
    simmat[row,"full_gate_s1"] <- full_IA_gate
    simmat[row,"y_plus_gate_s1"] <- y_plus_IA_gate
    simmat[row,"y_minus_gate_s1"] <- y_minus_IA_gate
    simmat[row,"full_gate_s2"] <- full_FA_gate
    simmat[row,"y_plus_gate_s2"] <- y_plus_FA_gate
    simmat[row,"y_minus_gate_s2"] <- y_minus_FA_gate
    simmat[row,"y_plus_responders_s1"] <- resp_y_plus_ia
    simmat[row,"full_responders_s1"] <- total_resp_ia
    simmat[row,"y_plus_responders_overall"] <- resp_y_plus_overall
    simmat[row,"full_responders_overall"] <- total_resp_overall
    simmat[row,"succ_ia_full"] <- IA_go_withF
    simmat[row,"succ_ia_y_pos"] <- IA_go_withYPlus
    simmat[row,"early_stop"] <- IA_ET
    simmat[row,"succ_overall_full"] <- SUCC_F
    simmat[row,"succ_overall_y_pos"] <- SUCC_YPlus

  }

  return(simmat)
}

rep = 5000

scen1 <- simseqoc(orr_plus_1,
               orr_minus_1,
               allcomers_ia,
               y_plus_ia,
               y_minus_ia,
               allcomers_overall,
               y_plus_overall,
               y_minus_overall,
               full_IA_gate,
               full_FA_gate,
               y_plus_IA_gate,
               y_plus_FA_gate,
               y_minus_IA_gate,
               y_minus_FA_gate,
               rep)

scen2 <- simseqoc(orr_plus_2,
               orr_minus_2,
               allcomers_ia,
               y_plus_ia,
               y_minus_ia,
               allcomers_overall,
               y_plus_overall,
               y_minus_overall,
               full_IA_gate,
               full_FA_gate,
               y_plus_IA_gate,
               y_plus_FA_gate,
               y_minus_IA_gate,
               y_minus_FA_gate,
               rep)

scen3 <- simseqoc(orr_plus_3,
               orr_minus_3,
               allcomers_ia,
               y_plus_ia,
               y_minus_ia,
               allcomers_overall,
               y_plus_overall,
               y_minus_overall,
               full_IA_gate,
               full_FA_gate,
               y_plus_IA_gate,
               y_plus_FA_gate,
               y_minus_IA_gate,
               y_minus_FA_gate,
               rep)

scen4 <- simseqoc(orr_plus_4,
               orr_minus_4,
               allcomers_ia,
               y_plus_ia,
               y_minus_ia,
               allcomers_overall,
               y_plus_overall,
               y_minus_overall,
               full_IA_gate,
               full_FA_gate,
               y_plus_IA_gate,
               y_plus_FA_gate,
               y_minus_IA_gate,
               y_minus_FA_gate,
               rep)

# 汇报结果 - 与壁报的Figure 6.2 OC for One stage Enrichment Design 对比
result <- data.frame(scenario=rep(NA,4),
                     prob_eff_full_IA=rep(NA,4),
                     prob_eff_positive_IA=rep(NA,4),
                     prob_ET_IA=rep(NA,4),
                     prob_eff_full_FA=rep(NA,4),
                     prob_eff_positive_FA=rep(NA,4))

result[1,"scenario"] <- "ORR (Y+) = ORR (Y-) = 16%"
result[2,"scenario"] <- "ORR (Y+) = 32%, ORR (Y-) = 16%"
result[3,"scenario"] <- "ORR (Y+) = 16%, ORR (Y-) = 32%"
result[4,"scenario"] <- "ORR (Y+) = ORR (Y-) = 32%"


result[1,"prob_eff_full_IA"] <- mean(scen1$succ_ia_full)*100
result[2,"prob_eff_full_IA"] <- mean(scen2$succ_ia_full)*100
result[3,"prob_eff_full_IA"] <- mean(scen3$succ_ia_full)*100
result[4,"prob_eff_full_IA"] <- mean(scen4$succ_ia_full)*100

result[1,"prob_eff_positive_IA"] <- mean(scen1$succ_ia_y_pos)*100
result[2,"prob_eff_positive_IA"] <- mean(scen2$succ_ia_y_pos)*100
result[3,"prob_eff_positive_IA"] <- mean(scen3$succ_ia_y_pos)*100
result[4,"prob_eff_positive_IA"] <- mean(scen4$succ_ia_y_pos)*100

result[1,"prob_ET_IA"] <- mean(scen1$early_stop)*100
result[2,"prob_ET_IA"] <- mean(scen2$early_stop)*100
result[3,"prob_ET_IA"] <- mean(scen3$early_stop)*100
result[4,"prob_ET_IA"] <- mean(scen4$early_stop)*100

result[1,"prob_eff_full_FA"] <- mean(scen1$succ_overall_full)*100
result[2,"prob_eff_full_FA"] <- mean(scen2$succ_overall_full)*100
result[3,"prob_eff_full_FA"] <- mean(scen3$succ_overall_full)*100
result[4,"prob_eff_full_FA"] <- mean(scen4$succ_overall_full)*100

result[1,"prob_eff_positive_FA"] <- mean(scen1$succ_overall_y_pos)*100
result[2,"prob_eff_positive_FA"] <- mean(scen2$succ_overall_y_pos)*100
result[3,"prob_eff_positive_FA"] <- mean(scen3$succ_overall_y_pos)*100
result[4,"prob_eff_positive_FA"] <- mean(scen4$succ_overall_y_pos)*100

# 评估程序运行时间
end_time <- Sys.time()

# 打印到txt文件
stargazer(result,
          title = "Interim & Final OC for Sequential Enrichment Design",
          summary = FALSE,
          rownames = FALSE,
          type = "text",
          align = TRUE,
          out = "两阶段富集设计OC.txt",
          notes = paste0("程序运行用时",as.character.Date(end_time-start_time),", 可对比辉瑞壁报Figure 8.2与Figure 8.3"),
          notes.align = "l")
Utility Function
function_cpp.cpp
#include <Rcpp.h>
using namespace Rcpp;

// [[Rcpp::export]]
NumericVector responsegate(int maxresponse,int samplesizestart,int maxsamplesize,double a,double b,double nv,double positivestatsig,double statsig,double postmed){
  // Creating object
  int row,totalrow,f1,f2,f3;
  double med,sig;
  totalrow = (maxsamplesize-samplesizestart+1)*(maxresponse);
  NumericMatrix df(totalrow,8);
  row = 0;
  // using loop to construct response matrix
  for(int r = 1; r <= maxresponse; ++r) {
    for(int n = samplesizestart; n <= maxsamplesize; ++n) {
      // generate beta random numbers
      NumericVector rand = Rcpp::rbeta( 100000, a+r, b+n-r);
      // compare to nv
      LogicalVector logicnv = rand >= nv;
      sig= mean(logicnv);
      med = median(rand);
      // output
      df(row,0) = r;
      df(row,1) = n;
      df(row,2)=sig;
      df(row,3)=med;
      // decision flag
      f1=0;
      f2=0;
      f3=0;
      if (sig<positivestatsig && med>=postmed){
        df(row,4)=1;
        f1=1;
        };
      if (sig>=positivestatsig && med>=postmed && sig<statsig){
        df(row,5)=1;
        f2=1;
        };
      if (sig>=statsig && med>=postmed){
        df(row,6)=1;
        f3=1;
        };
      // 2-full,3-positive only,4-n/a
      if (f3==1){
        df(row,7) = 2;
      } else if(f2==1){
        df(row,7) = 3;
      } else if (f1==1){
        df(row,7) = 4;
      }
      row++;
    }
  }
  return df;
}
predprobMedian.cpp
#include <Rcpp.h>
using namespace Rcpp;


// [[Rcpp::export]]
double predprobMedian(int x, int n, int nmax, double alpha, double beta, double theta_t) {

  double prob = 0.0;
  double eps = std::numeric_limits<double>::epsilon();
  double med;

  for (int resp = 0; resp < nmax - n + 1; resp++) {
    // --------------------------------------------------------
    // --- use median instead of posterior in pfizer's settings
    // --------------------------------------------------------
    // generate beta random numbers
    NumericVector rand = Rcpp::rbeta( 100000, alpha + x + resp, beta + nmax - x - resp);
    med = median(rand);
    if (med > theta_t || std::abs(med - theta_t) < eps) {
      prob += exp(
        R::lchoose(nmax - n, resp) +
          R::lbeta(alpha + x + resp, beta + nmax - x - resp) -
          R::lbeta(alpha + x, beta + n - x)
      );
    }
  }

  return prob;

}
predprobPosterior.cpp
#include <Rcpp.h>
using namespace Rcpp;


// [[Rcpp::export]]
double predprobPosterior(int x, int n, int nmax, double alpha, double beta, double p0, double theta_t){

  double prob = 0.0;
  double eps = std::numeric_limits<double>::epsilon();
  double pxy;

  for (int resp = 0; resp < nmax - n + 1; resp++) {
    pxy = (1.0 - R::pbeta(p0, alpha + resp + x, beta + nmax - resp - x, 1, 0));
    if (pxy > theta_t || std::abs(pxy - theta_t) < eps) {
      prob += exp(
        R::lchoose(nmax - n, resp) +
          R::lbeta(alpha + resp + x, beta + nmax - resp - x) -
          R::lbeta(alpha + x, beta + n - x)
      );
    }
  }
  return prob;
}
OC
Interim & Final OC for Sequential Enrichment Design
=====================================================================================================================
           scenario            prob_eff_full_IA prob_eff_positive_IA prob_ET_IA prob_eff_full_FA prob_eff_positive_FA
---------------------------------------------------------------------------------------------------------------------
  ORR (Y+) = ORR (Y-) = 16%         24.280             16.360          59.360        1.060              4.080
ORR (Y+) = 32%, ORR (Y-) = 16%      59.740             35.800          4.460         14.780             73.860
ORR (Y+) = 16%, ORR (Y-) = 32%      70.980             1.640           27.380        28.160             0.540
  ORR (Y+) = ORR (Y-) = 32%         96.020             2.620           1.360         88.340             8.040
---------------------------------------------------------------------------------------------------------------------
程序运行用时1.384589 mins, 可对比辉瑞壁报Figure 8.2与Figure 8.3
Appendix - Comparison of R & RCPP
library(Rcpp)
sourceCpp('function_cpp.cpp')

# Rcpp

start_time <- Sys.time()
aaa <- responsegate(maxresponse = 100,samplesizestart = 30,maxsamplesize = 200,a = 0.1904762,b = 1,nv = 0.16,positivestatsig = 0.95,statsig = 0.975,postmed = 0.24)
end_time <- Sys.time()

# R
start_time2 <- Sys.time()
nv = 0.16
statsig = 0.975
clinicalsig = 0.75
postmed = 0.24
positivestatsig = 0.95
maxsamplesize = 200 #我们能接受的样本量的上限,但是设太低可能会找不到
samplesize_start = 30 #实际应用中,总不可能样本量从1开始的
maxresponse = 100 #实际应用中可能出现的最高的responders数量?

beta_a = 0.1904762 #先验变化会对minimum sample size有影响,就算是无信息先验
beta_b = 1

totalrow = (maxsamplesize-samplesize_start+1)*(maxresponse)

# bothfl: for Bayesian dual criteria for Y+ patients
# tripfl: for Bayesian triplet criterion for all patients
df <- data.frame(r=rep(NA,totalrow),
                 n=rep(NA,totalrow),
                 significance=rep(NA,totalrow),
                 postmedian=rep(NA,totalrow),
                 justmedfl=rep(FALSE,totalrow),
                 bothfl=rep(FALSE,totalrow),
                 tripfl=rep(FALSE,totalrow),
                 group=rep(NA,totalrow))

row <- 1

for (r in 1:maxresponse){
  for (n in samplesize_start:maxsamplesize){
    if (r>n) {
      next
    }
    rand <- rbeta(100000,beta_a+r,beta_b+n-r)
    sig <- mean(rand>=nv)
    med <- median(rand)
    df[row,1]=r
    df[row,2]=n
    df[row,3]=sig
    df[row,4]=med
    # 仅满足一个标准(median>xxx)
    if (sig<positivestatsig & med>=postmed){df[row,5]=TRUE}
    # 仅满足两个标准(median>xxx与阳性显著)
    if (sig>=positivestatsig & med>=postmed & sig<statsig){df[row,6]=TRUE}
    # 满足三个标准(median>xxx与全人群显著)
    if (sig>=statsig & med>=postmed){df[row,7]=TRUE}
    # 为绘图分组
    if (df[row,7]==TRUE){
      df[row,8] <- "full"
    } else if(df[row,6]==TRUE){
      df[row,8] <- "positive only"
    } else if (df[row,5]==TRUE){
      df[row,8] <- "N/A"
    }
    row <- row+1
  }
}
end_time2 <- Sys.time()

# compare
cat("Rcpp takes: ",end_time - start_time," secs")
cat("R code takes: ",end_time2 - start_time2," secs")