Primary Outcome Measures
Percentage of Participants with Best Overall Response (ORR)
NOTE THAT THE FOLLOWING CODES ARE USED FOR DEMONSTRATING ONLY. THE EXECUTABLE CODES WILL NOT BE ATTACHED HERE. R IS THE TOOL FOR BAYESIAN HIERARCHICAL MODELING.
The purpose of this study is to evaluate the objective response rate (complete response [CR]+ partial response [PR]) of the selected dose regimen in participants with cancers that harbor specific genomic alterations.
This is a multicenter, open-label study (participants will know the identity of study drugs administered) to evaluate the efficacy and safety of STUDY DRUG in participants with urothelial cancer.
The study comprises a 30-days Screening Phase, a Treatment Phase comprised of 28-day treatment cycles that will continue until specific event occurs, and a post-treatment Follow-up Phase that will extend from the End-of-Treatment Visit (EOT) until the participant has died, withdraws consent, is lost to follow-up, or the end of the study, whichever comes first.
There are 15 tumor histologies in the basket trial. The Prevalence of tumor histology (3rd column in the following table) will be used in simulation when generating a patient with specific tumor histology.
| Cancer Type | Target XX Frequency (%) | Anticipated Tumor Representation in Target XX+ Population plus “Other” Group (%) |
|---|---|---|
| a | 21 | 18 |
| b | 4 | 18 |
| c | 9 | 13 |
| d | 3 | 13 |
| e | 2 | 10 |
| f | 11 | 5 |
| g | 7 | 4 |
| h | 5 | 4 |
| i | 2 | 3 |
| j | 8 | 2 |
| k | 1 | 2 |
| l | 3 | 1 |
| m | 1 | 1 |
| n | 2 | 1 |
| o | 1 | - |
| other | - | 5 |
Percentage of Participants with Best Overall Response (ORR)
set.seed(123)This code was developed as a personal exercise and has not been fully validated.
There will be 2 interim futility analyses and 1 final analysis when
datacut = c(60,130,200) # 200 is final analysis\[ posterior \ P(ORR>0.25)<0.4 \]
\[ posterior \ P(ORR>0.25)>0.8 \]
Before pooling, a futility analysis with the futility criteria above at final efficacy analysis on all tumor histologies to decide the tumor agnostic pool and which histology should not succeed as a pool. An exact binomial test in the final pooled efficacy analysis with a null hypothesis \(ORR=0.15\) and an alternative hypothesis \(ORR>0.15\) at \(\alpha=0.05\).
# set the total sample size
ss <- 200

# set the cap for each cohort
cap <- 30

# set the accrual rate to 10/7 subjects/week
accrate = 10/7 <- 10/7
For each participant, we assume that a confirmed CR/PR is available after 28 days from their first tumor assessment.
trdur = 4*7The following process simulates the assignment to corresponding tumor histology.
Note that letters A to O will be used to represent the 15 tumor histology in simulation.
Input the proportion of each tumor histology for enrollment into the trial:
tumorprop = c(18,18,13,13,10,5,4,4,3,2,2,1,1,1,5)*0.01There are 6 different scenarios that are based on the assumed true ORR for each tumor histology. Six scenarios are shown, with different true ORRs for each histology.
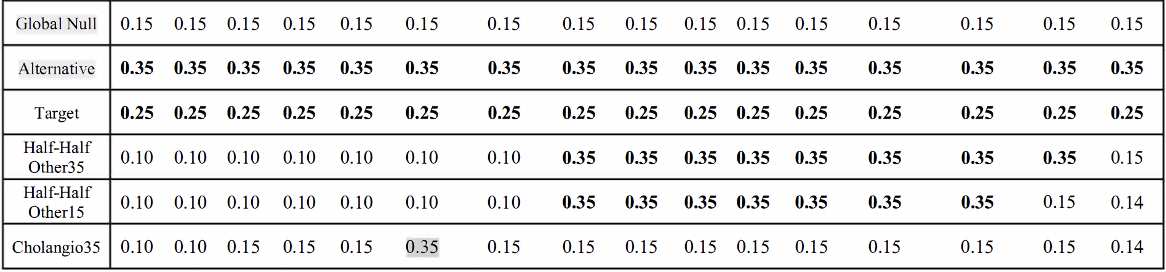
Different scenarios will be used to evaluate different operating characteristics which will be introduced later.
The Global Null scenario is to evaluate the false positive rate (FPR) for the final pooled efficacy analysis and the family-wise error rate (FWER) with BHM analysis.
The scenarios Alternative and Target are for power assessment.
The scenarios Half-Half Other35, Half-Half Other15, and Cholangio35, with their original tumor agnostic pooled ORR at the null, are designed to assess the impact of futility and to evaluate the FPR for final pooled efficacy analysis.
Selection power is the proportion of simulations that selected at least a given percentage of active tumor histologies (e.g. 80%) to be pooled for final efficacy analysis.
Proportion of success is the proportion of simulations in which BHM claimed at least one tumor histology as a success. Similarly, the success criteria \((Pr(ORR > 25\%) > 80\% )\) is used for BHM to claim a success (efficacy) for a given tumor histology.
FWER represents the proportion of simulations in which BHM claimed false-positive efficacy in one or more of the nonactive tumor histologies. Note that the success criteria \((Pr(ORR > 25\%) > 80\%)\) is used for BHM to claim a success (efficacy) for a given tumor histology.
Power is calculated as the proportion of simulations claiming a success (efficacy) on the Pooled data of final efficacy analysis. Note that a futility analysis should be perform to decide which histology will be succeed in pooled efficacy analysis.
FPR is defined as the proportion of simulations claiming a false-positive success (efficacy) on the pooled data of final efficacy analysis. Note that a success is false-positive only when the weighted average of true ORRs is less than 15% (It should be <= 15% in practice) for the remaining histologies that didn’t meet the futility criteria in the final pool for efficacy analysis. The weights are the renormalized assumed prevalence in for each tumor histology that ended up in the final pool.
Mixing nonactive is defined as the proportion of claiming a success (efficacy) in the pooled data at the final efficacy analysis that is mixed with at least one nonactive histology.
5000 simulation runs will be conducted to evaluate the operating characteristics of the proposed design.
multiplier = 3Generate histology, response, relative enrollment day, confirmed PR/CR day for each record (participant);
Create a counter to check if the sample size of a histology reaches the cap. If yes, the recruitment for this histology will be stopped.
Flag all qualifying 60 records for 1st interim analysis) and those records with relative enrollment day <= the maximum relative enrollment day (in those 60 participants) + 28 days for 2nd interim analysis.
Delete all other records unflagged.
Generally follow the ideas described in 1. But for those histology that does not pass the 1st interim futility analysis, recruitment will be also stopped in this kind of cohort.
Note that, the way of implementing the generation of the following random numbers is different from that in
RJAGS. The following contents in this part are provided for illustration purpose.
Denote \(\pi_g=Pr(response \mid treatment, g)\), the BHM models the log-odds response (i.e. ORR)
defined as
$$ _g=logit(_g)=
\[ with weak prior \]
_g N(,^2) \ N(-2.19,2^2) $$
And $^2 $ Inverse Gamma with mean 2 and weight 0.75.
Some points need to be noticed:
\[ \pi_g=\frac{exp(\theta_g)}{1+exp(\theta_g)} \]
library(invgamma)

# generate the hyper-parameters for tau^2 by inverse gamma
Tau2_ab <- function(mean,weight){
  a <- weight/2
  b <- (mean^2)*weight/2
  return(c(a,b))
}

# call the function and validate by visualization
invgamma_input <- Tau2_ab(2,0.75)
x_dinvgamma <- seq(0, 10, by = 0.01)

# Apply dinvgamma function
y_dinvgamma <- dinvgamma(x_dinvgamma,invgamma_input[1],invgamma_input[2])

# Plot tau^2
plot(x_dinvgamma,y_dinvgamma,type="l")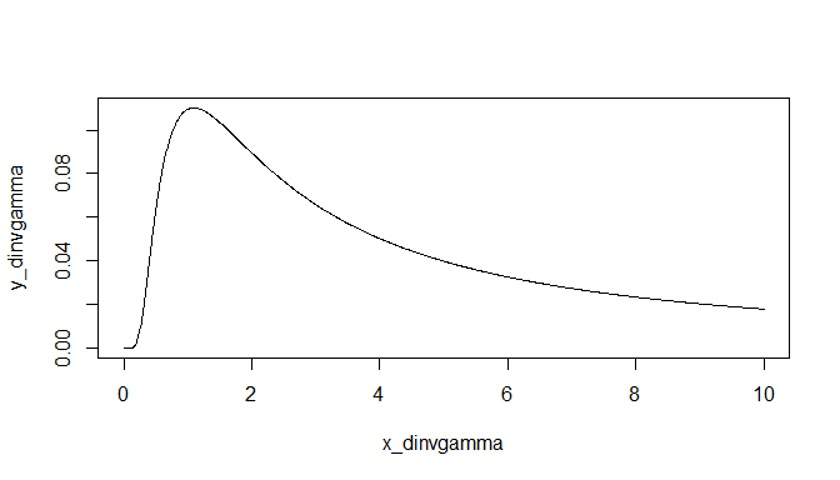
For the setting of hierarchical modeling in RJAGS, the 2nd parameter in dnorm(mean,precision) is precision instead of variance or standard deviation.
The overall bayesian calculation looks like the following codes. We need to set a number for burn-in chains in order to get a Markov Chain reaches its equilibrium distribution.
  # set burn in
  burn.in = 2000

  # DEFINE the BH model
  bayes_model <- "model{
    # Likelihood model for PiG
    for (i in 1:length(K)){
      K[i] ~ dbin(orr[i],n[i])
      orr[i] <- exp(thetag[i])/(1+exp(thetag[i]))
    }
    for (i in 1:length(K)){
      thetag[i] ~ dnorm(mu,tau2)
    }

    # Prior model for thetag,mu,tau2
    mu ~ dnorm(a, b)
    # sigma2 <- 1/tau2
    ## inverse gamma
    tau2 ~ dgamma(alpha,beta)
    }"

  bayes_jags_IA <- jags.model(
    textConnection(bayes_model),
    data = list(
      a = a,
      b = b,
      K = summary_adam$responders,
      alpha = invg_a,
      beta = invg_b,
      n = summary_adam$n
    ),
    inits = list(.RNG.name = "base::Wichmann-Hill", .RNG.seed = mcmc_seed),
    quiet = TRUE
  )
  # mcmc to generate the posterior
  update(bayes_jags_IA, burn.in)
  bayes_sim_IA <-
    coda.samples(model = bayes_jags_IA,
                 variable.names = c("orr"),
                 n.iter = mcmc_iter)
  # Store the chains in a matrix -- source of posterior of orr
bayes_chains_IA <- bayes_sim_IA[[1]]An exact binomial test should be performed on the histologies that succeed in the futility analysis before pooling.
pooltotalresp is the number of total responders in the histologies being pooled;
poolsamplesize is the number of total sample size in the histologies being pooled.
p0 is 0.15 in this case.
binom.test(x=pooltotalresp,n=poolsamplesize,p=p0,alternative = "greater")The results are generated by invoking Analysis2.R. Results are represented as

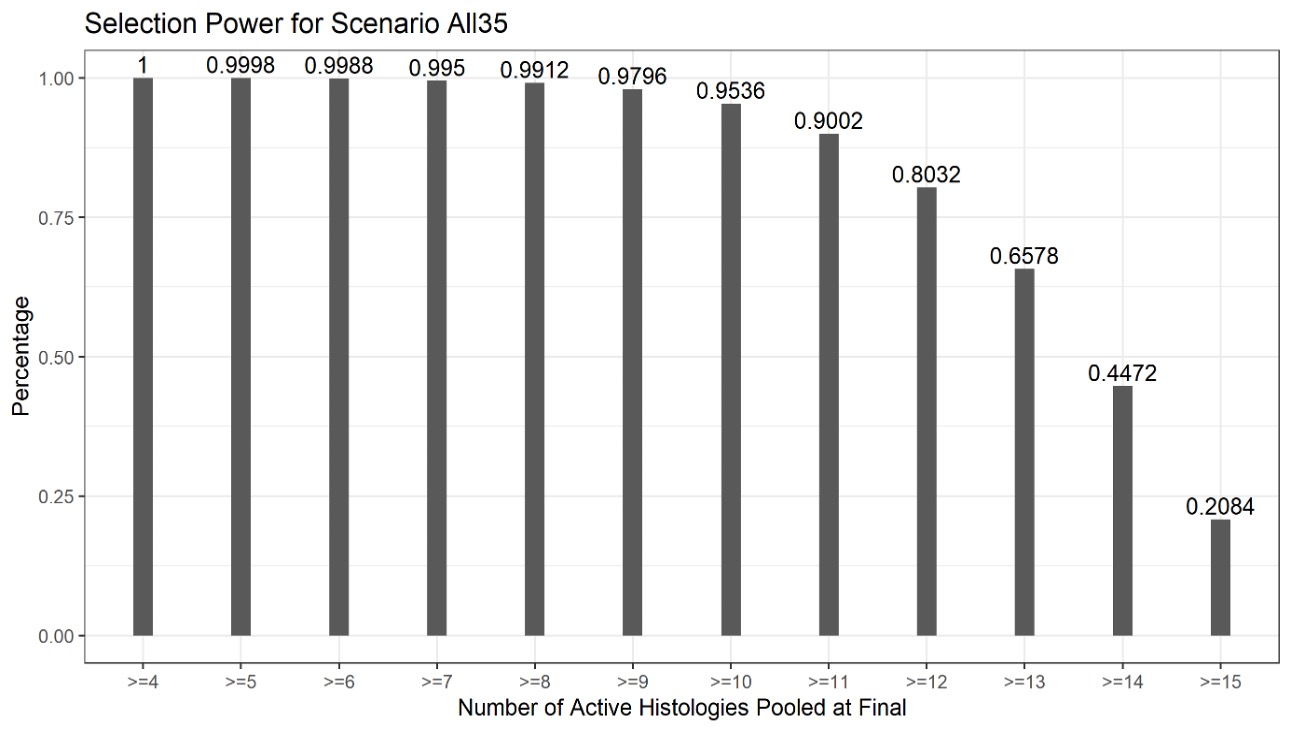
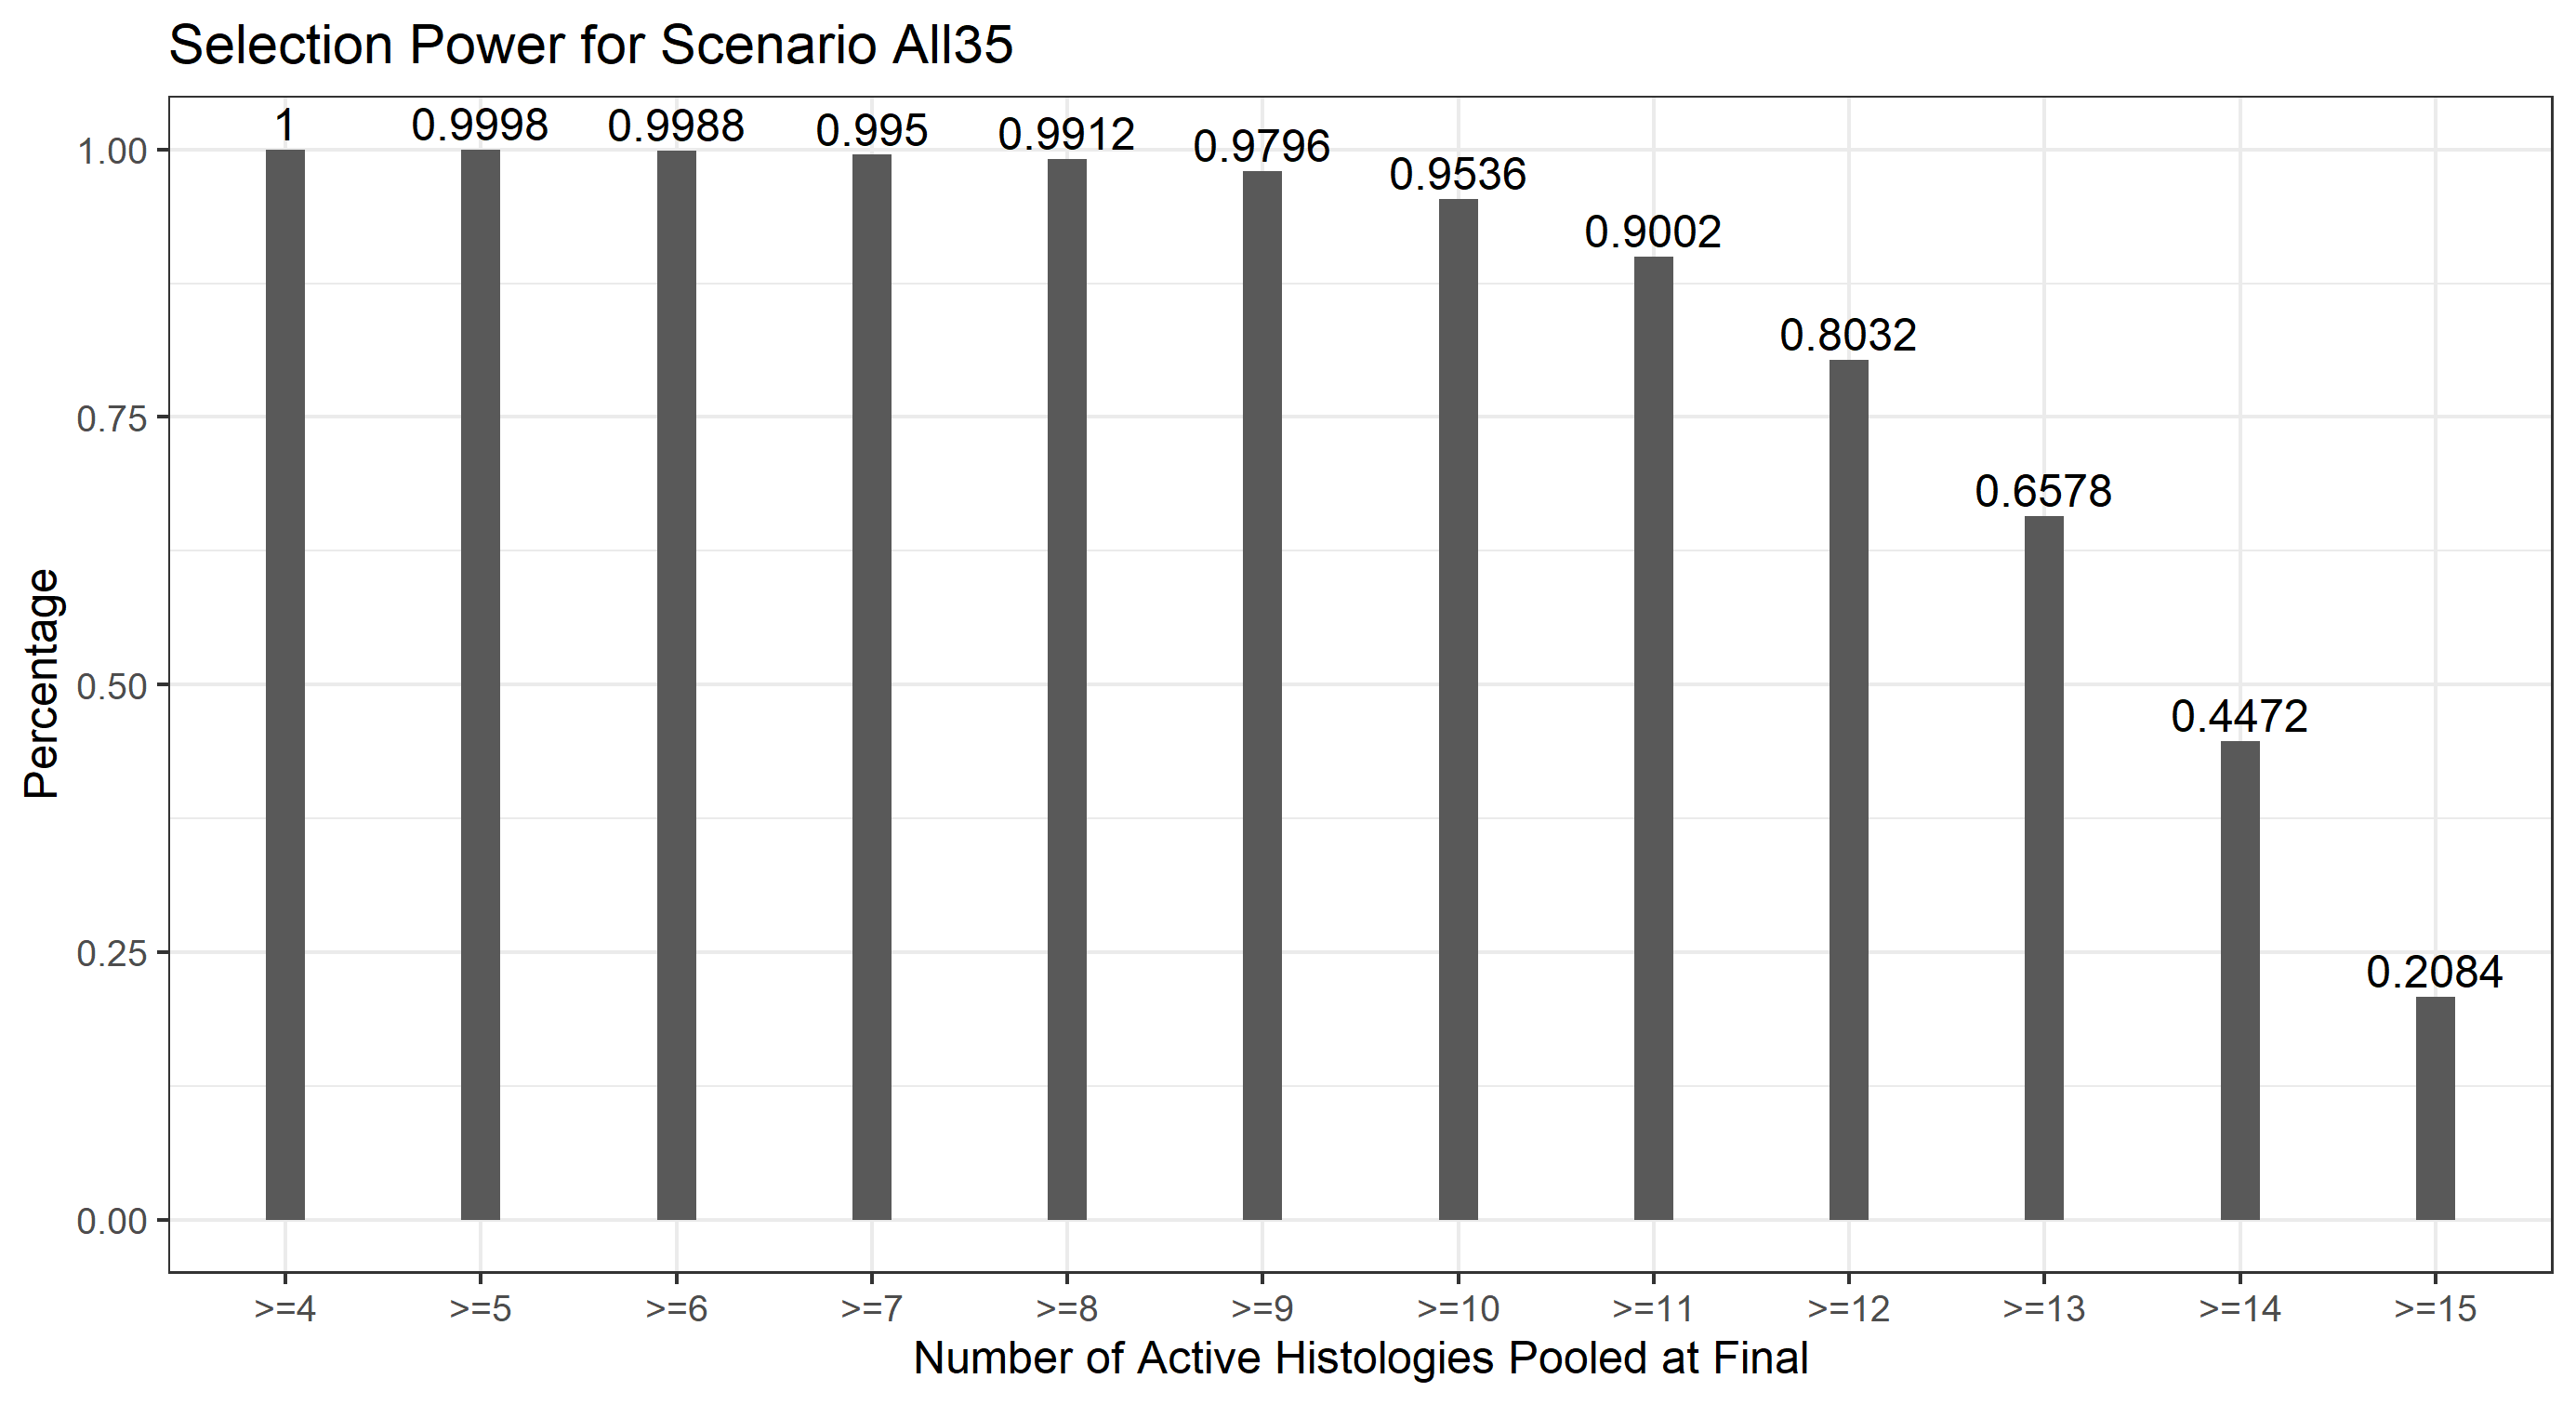
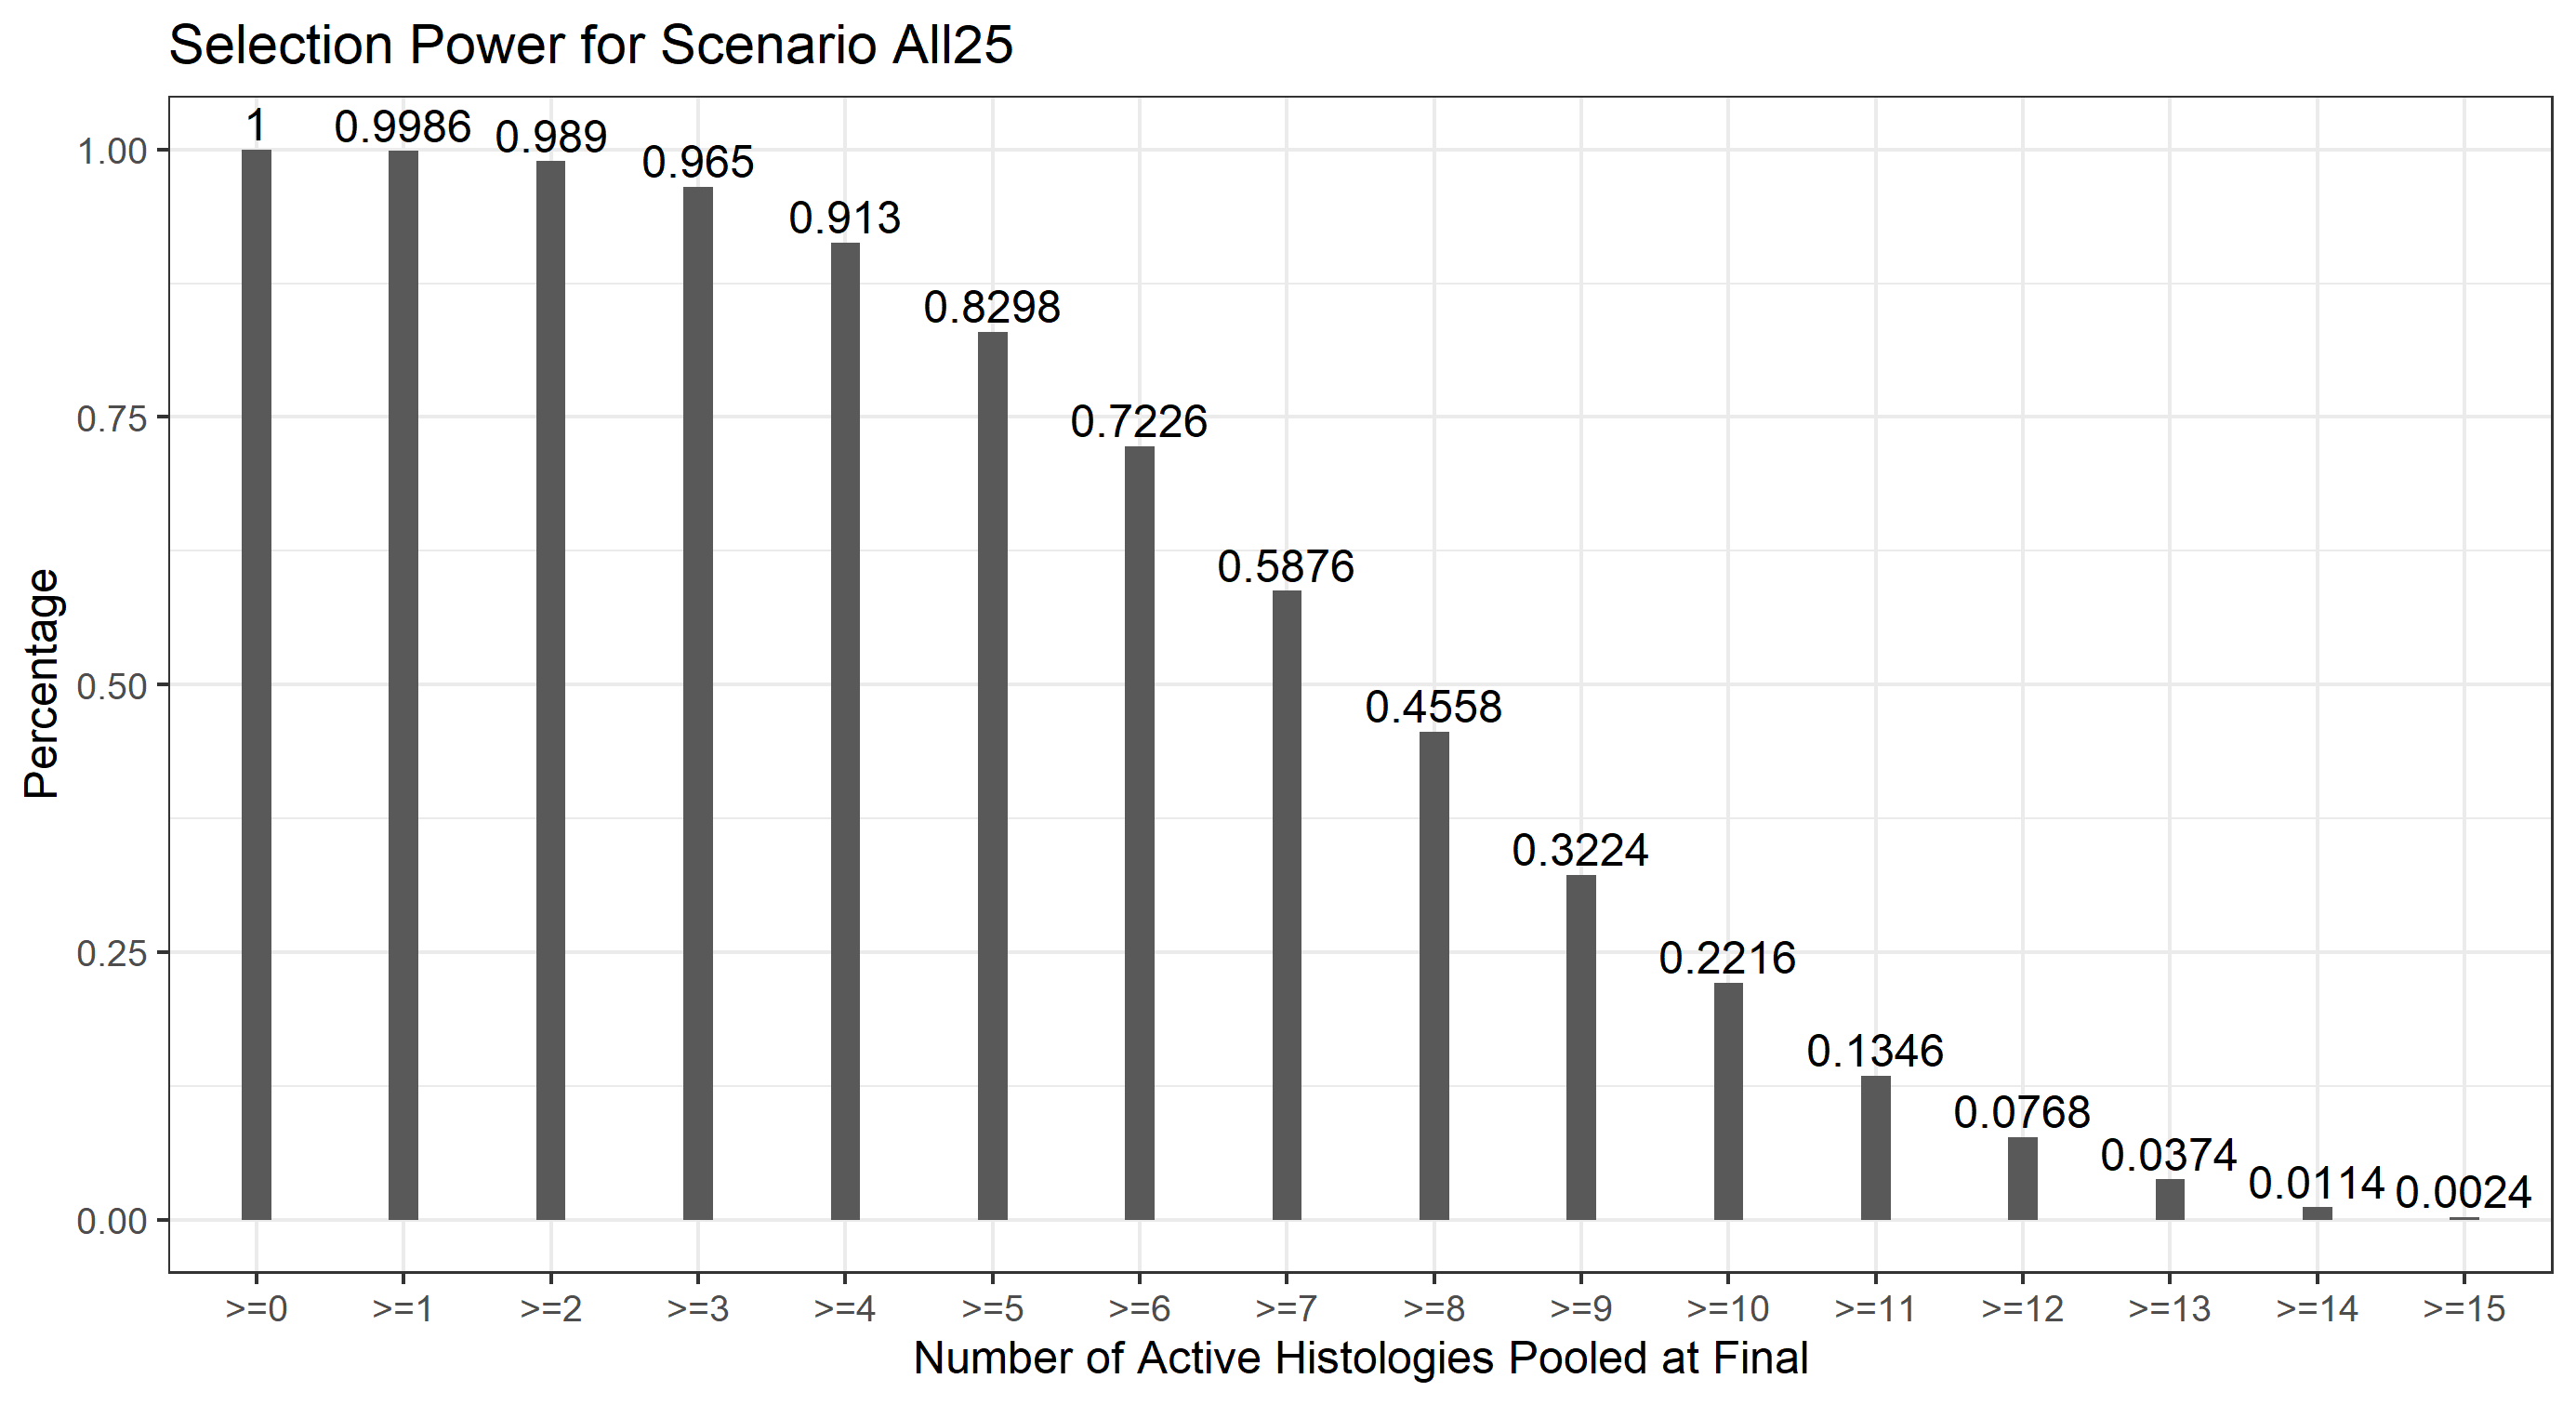
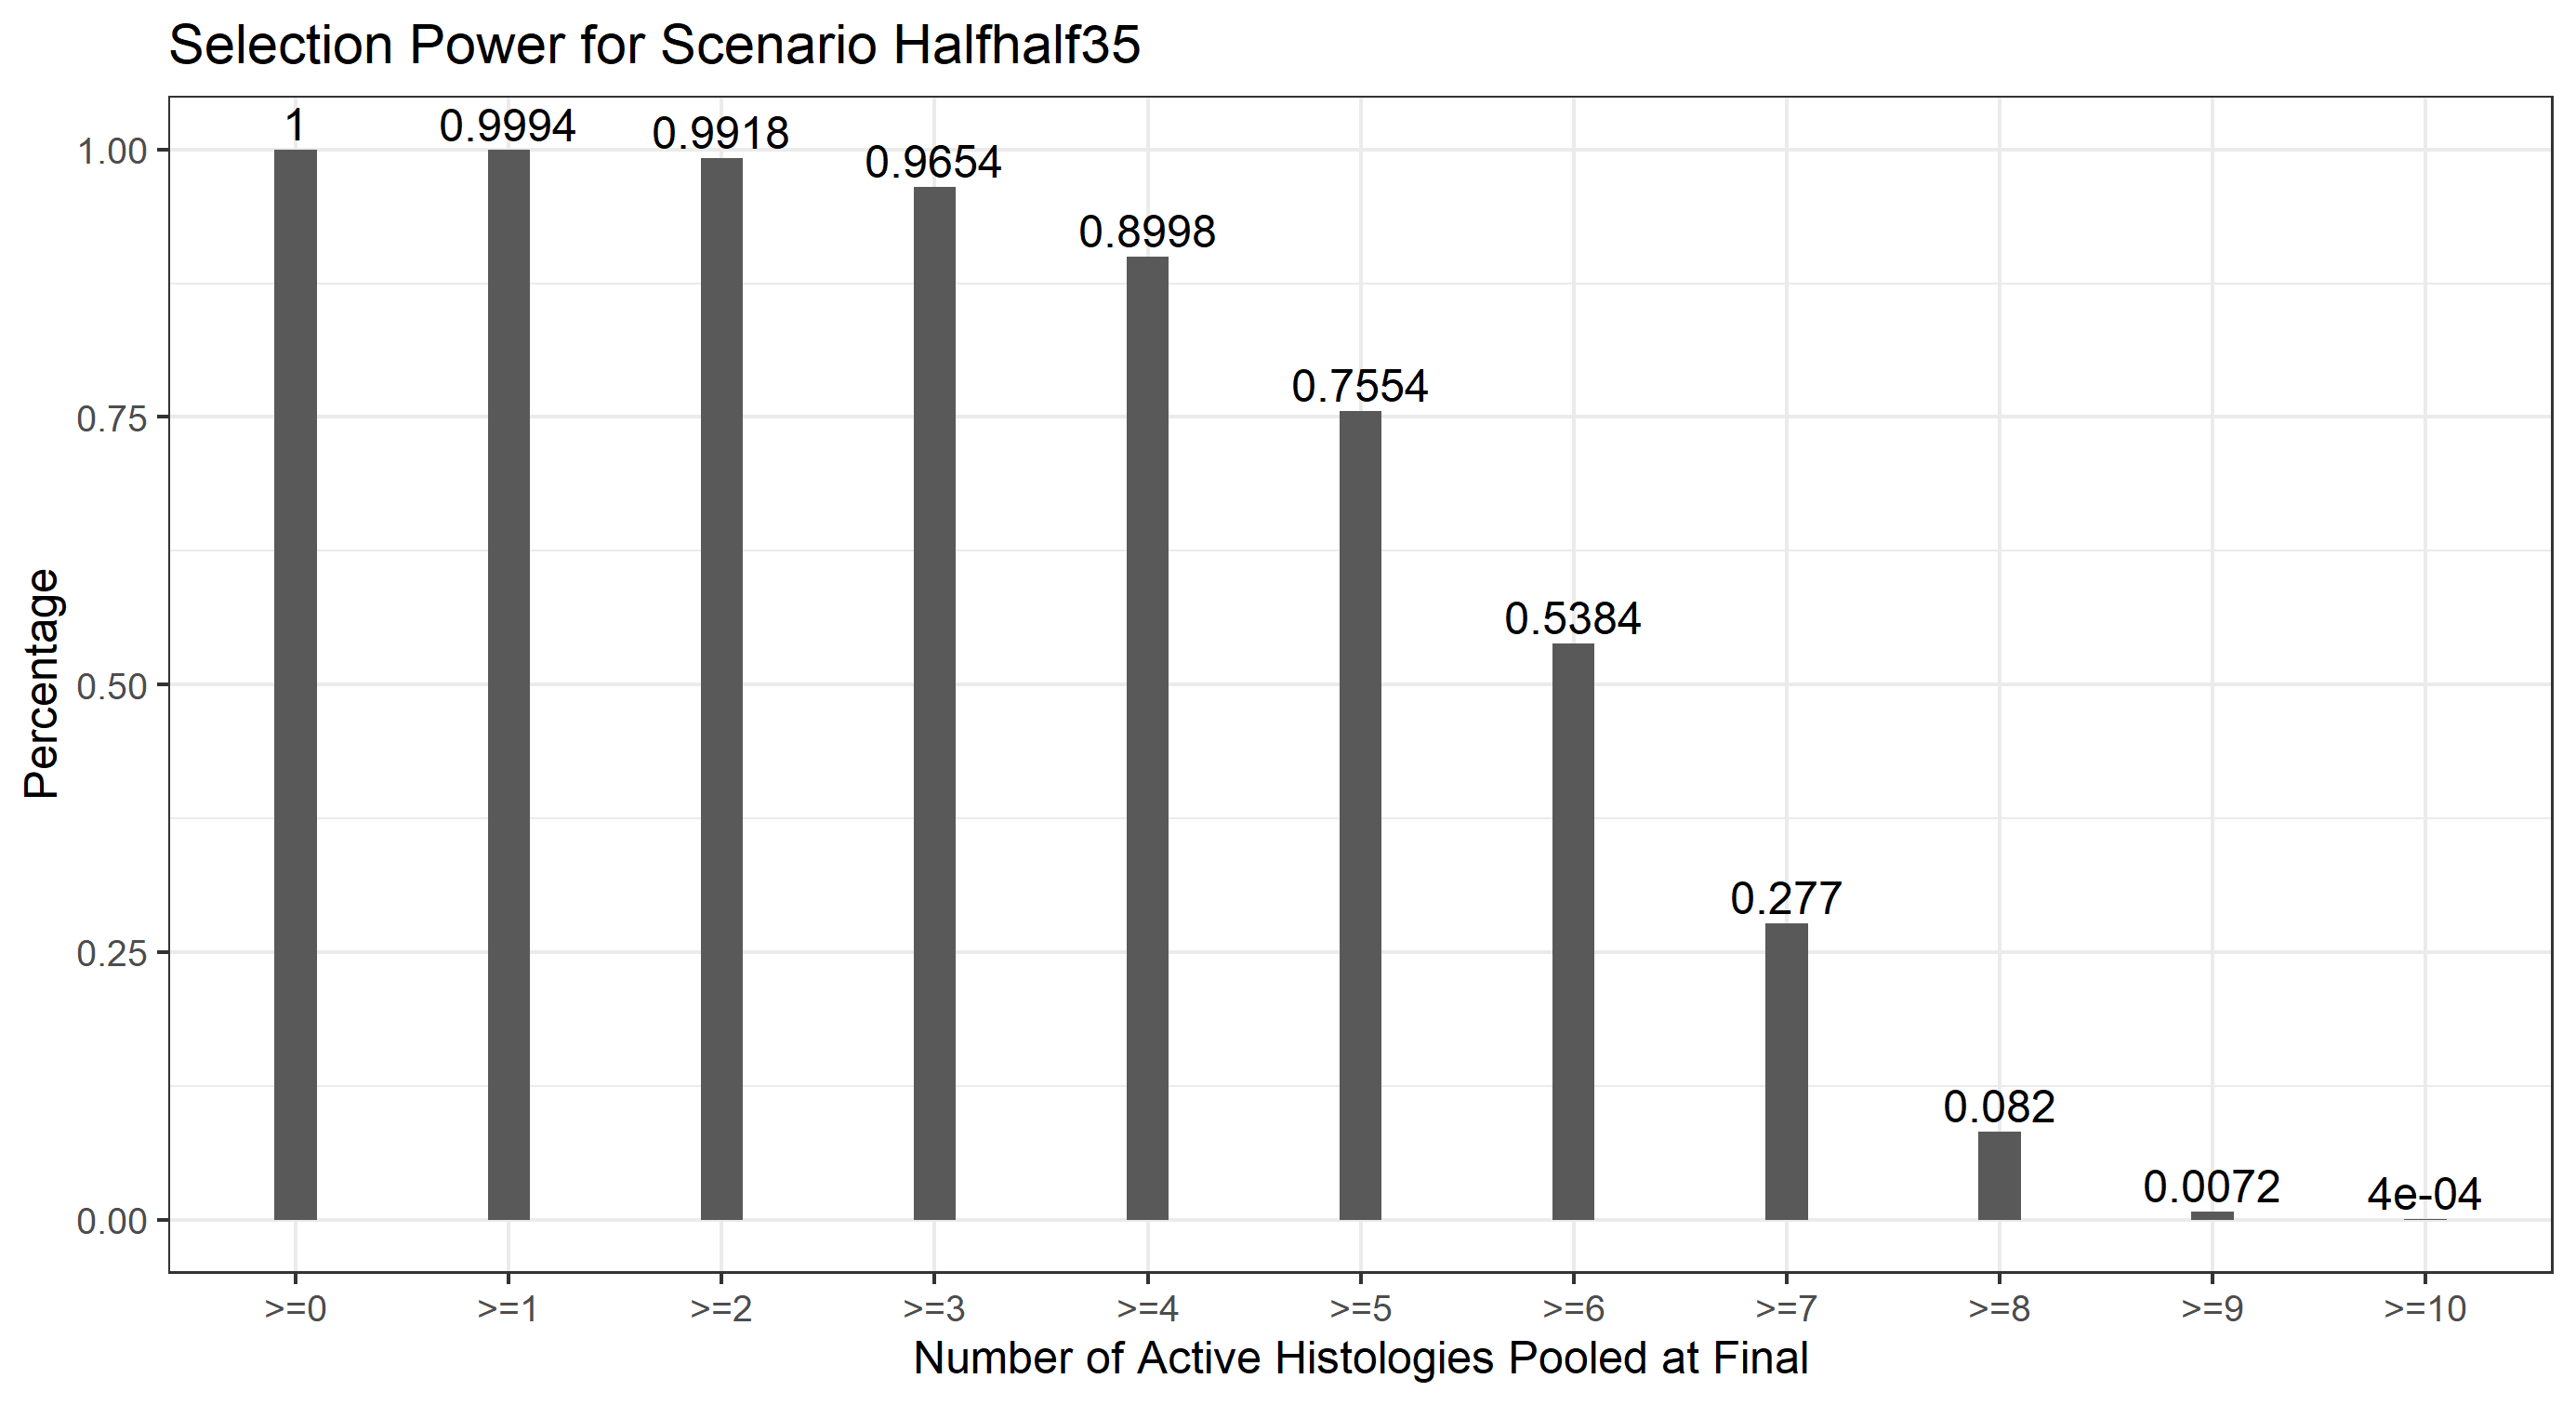
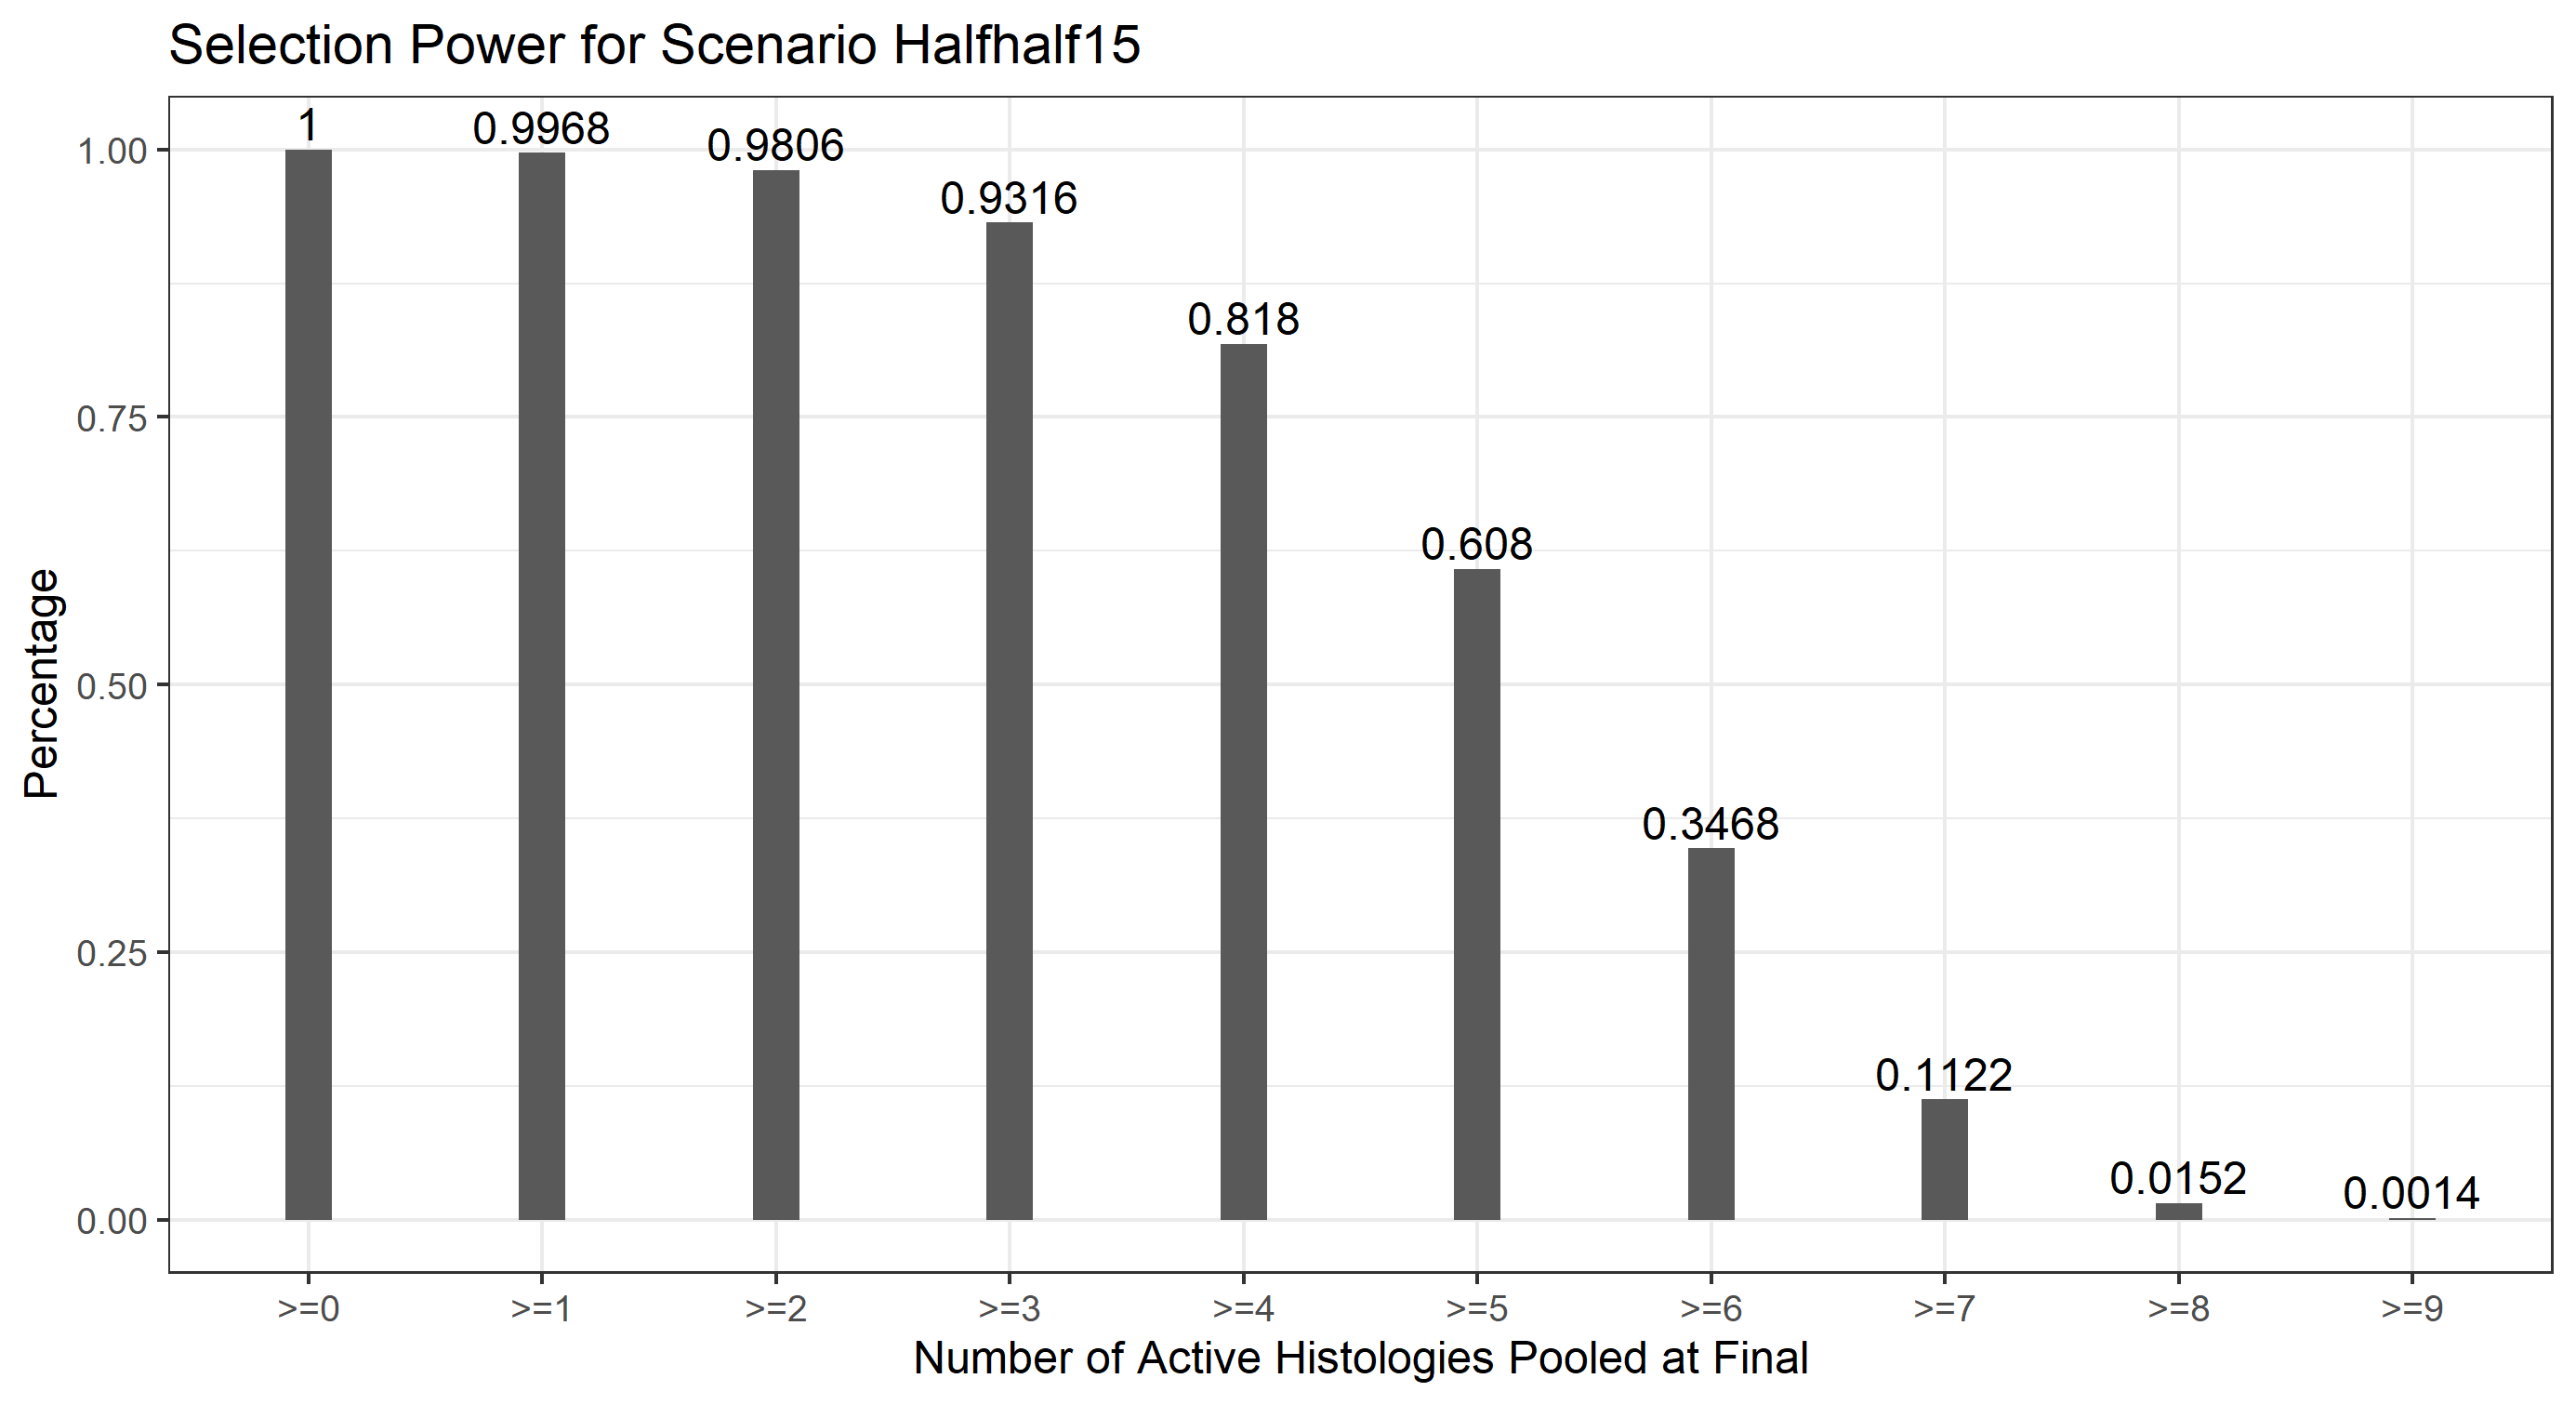
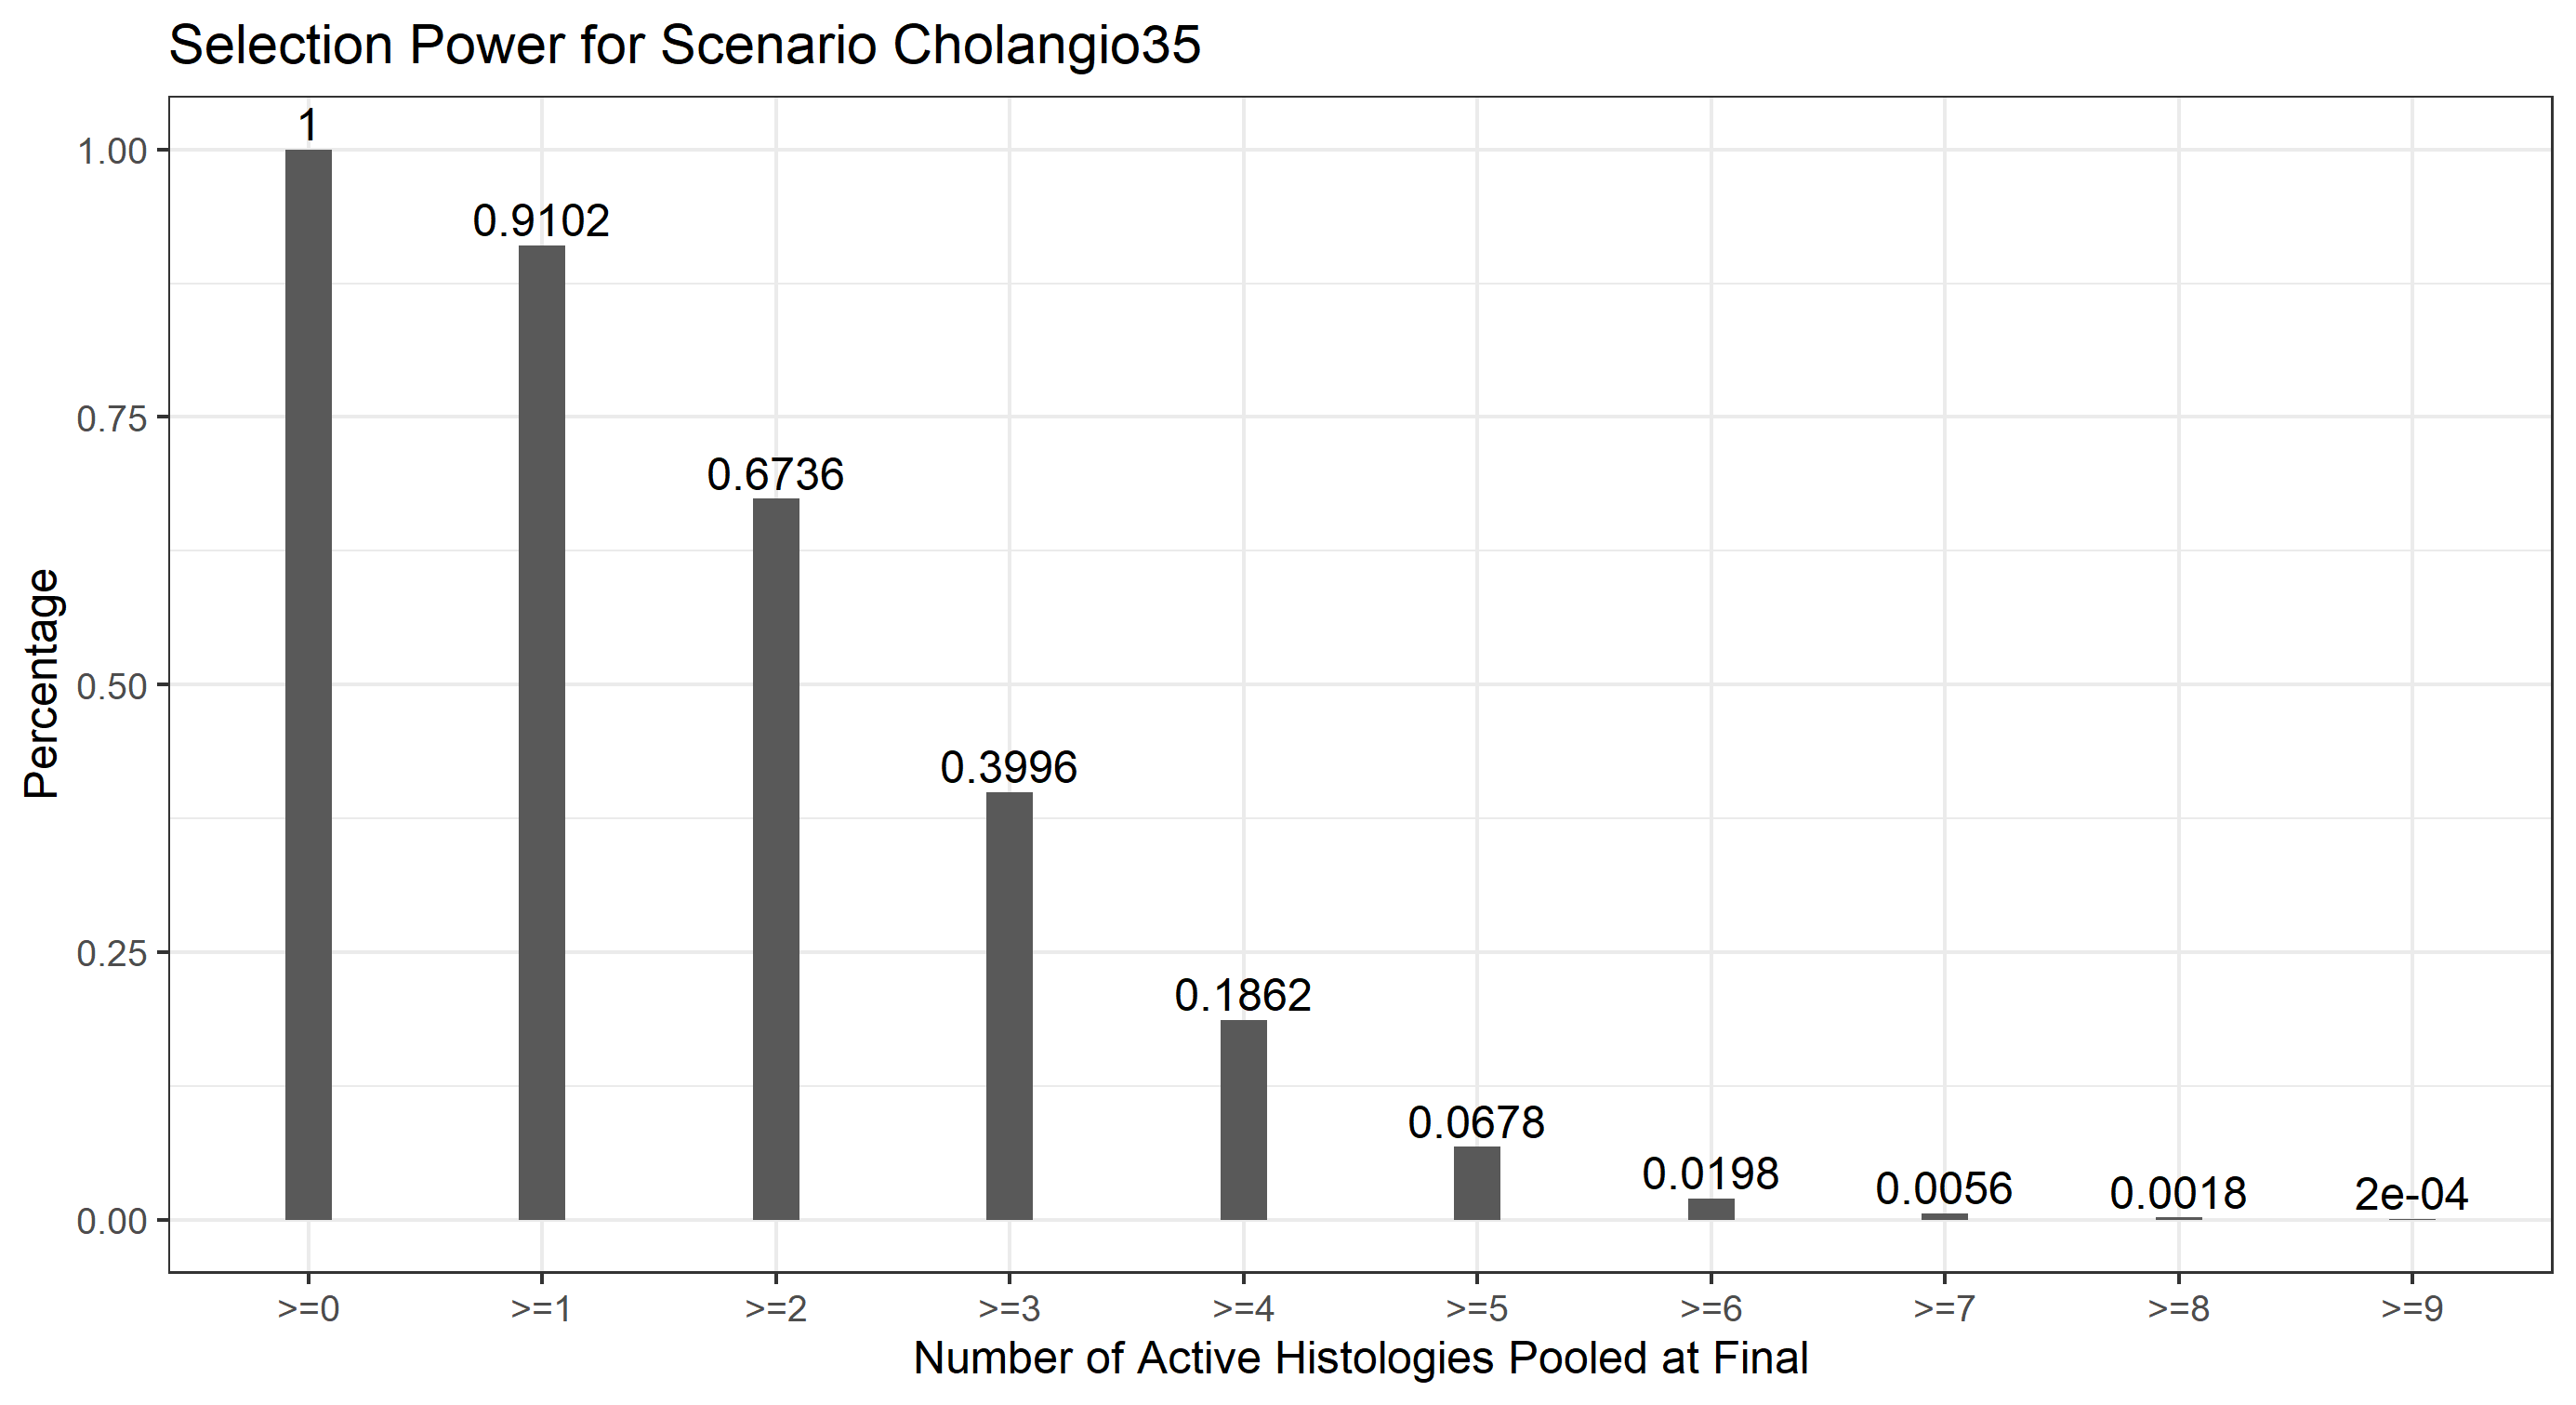
function2.R : contains utility functions and main functions to perform simulationsTrialSim2.R : contains input parameters and parallel calculating settings to perform simulationsAnalysis2.R : contains functions to analysis and output the results of simulationsTrialSim2.R, comment or uncomment the following lines to choose corresponding scenarios to generate simulated dataset.# trueorr = rep(0.15,15)
# trueorr = rep(0.25,15)
# trueorr = rep(0.35,15)
# trueorr = c(rep(0.10,7),rep(0.35,7),0.15) # use half-half other 15 settings
trueorr = c(rep(0.10,7),rep(0.35,8)) # use half-half other 35 settings
# trueorr = c(rep(0.10,2),rep(0.15,3),0.35,rep(0.15,9)) # use Cholangio35 settingsSet the location and name of output dataset
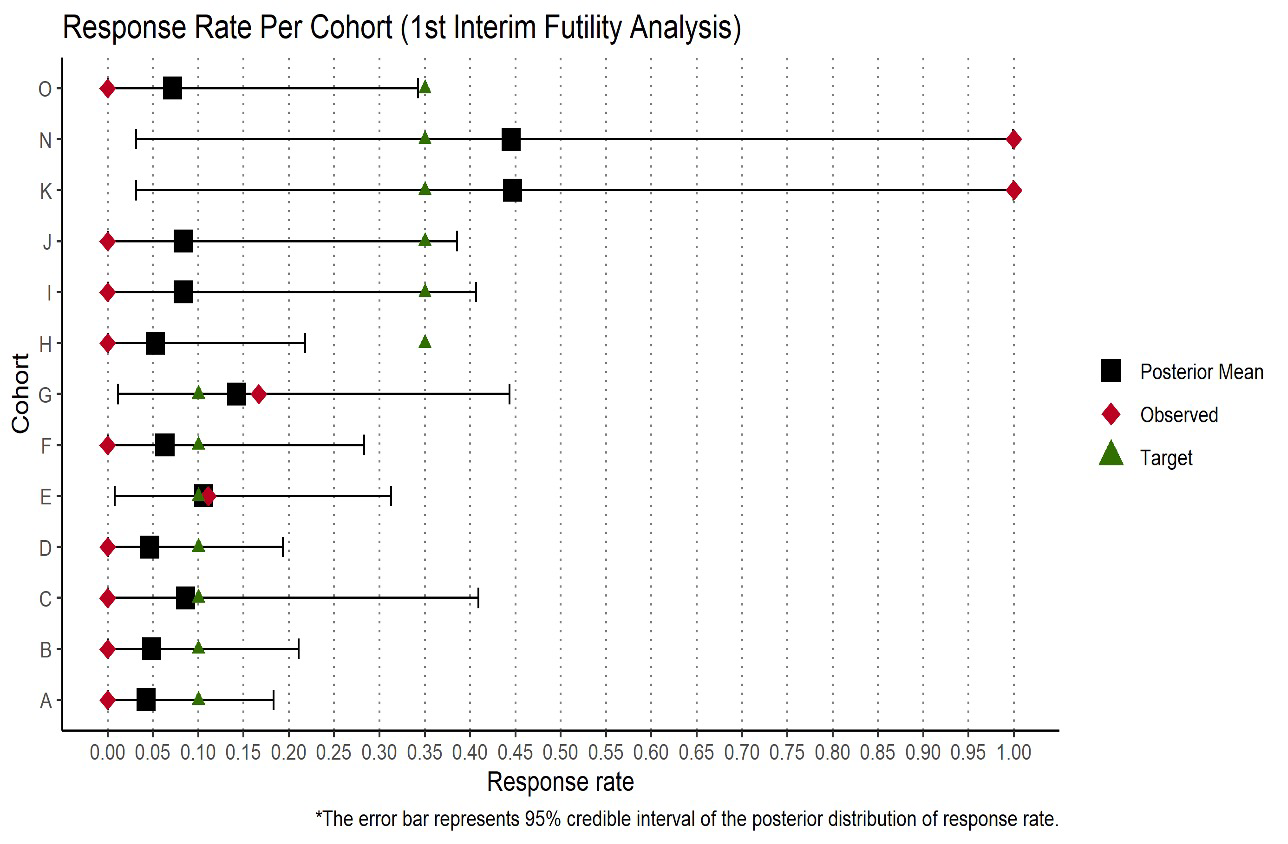
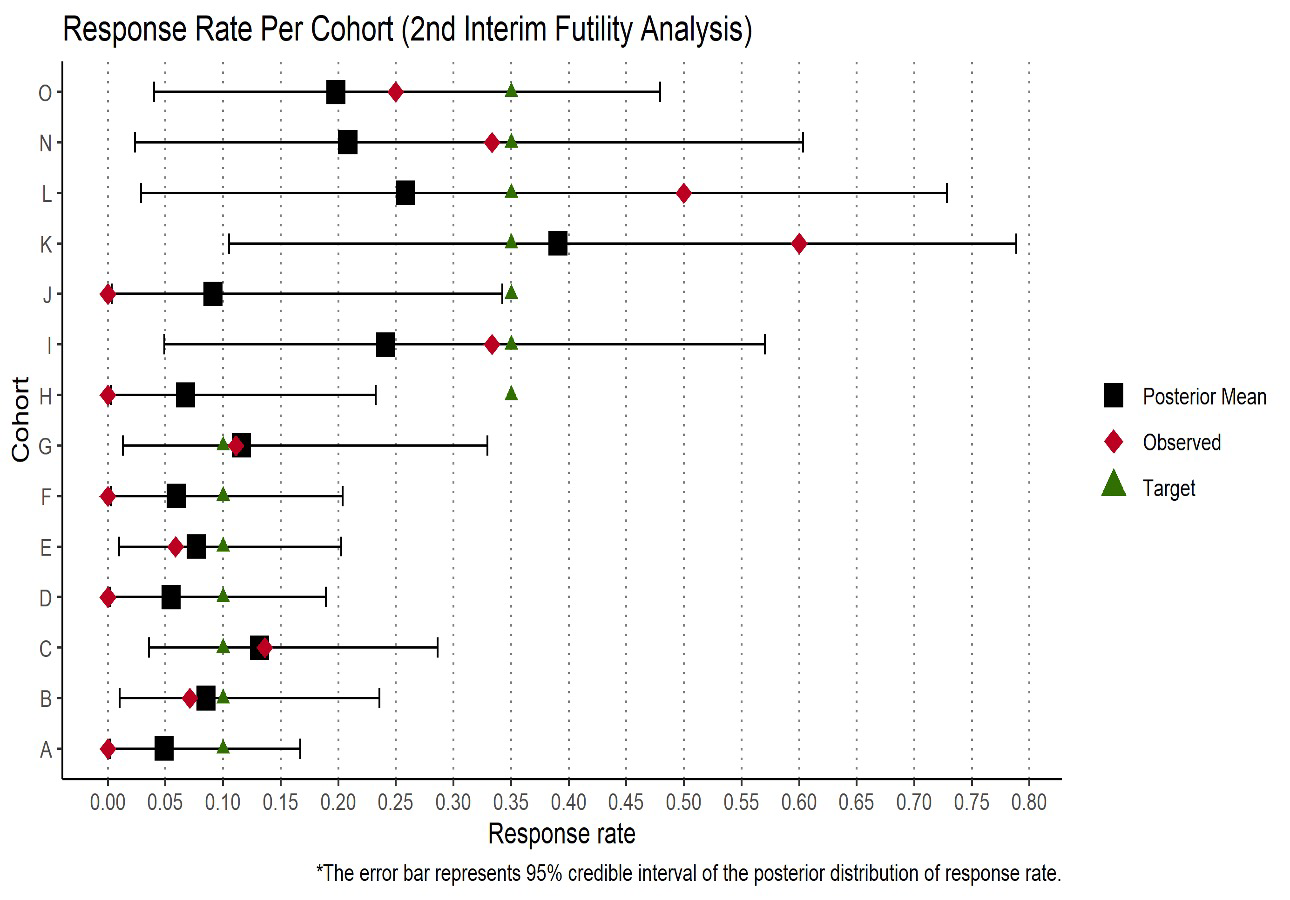
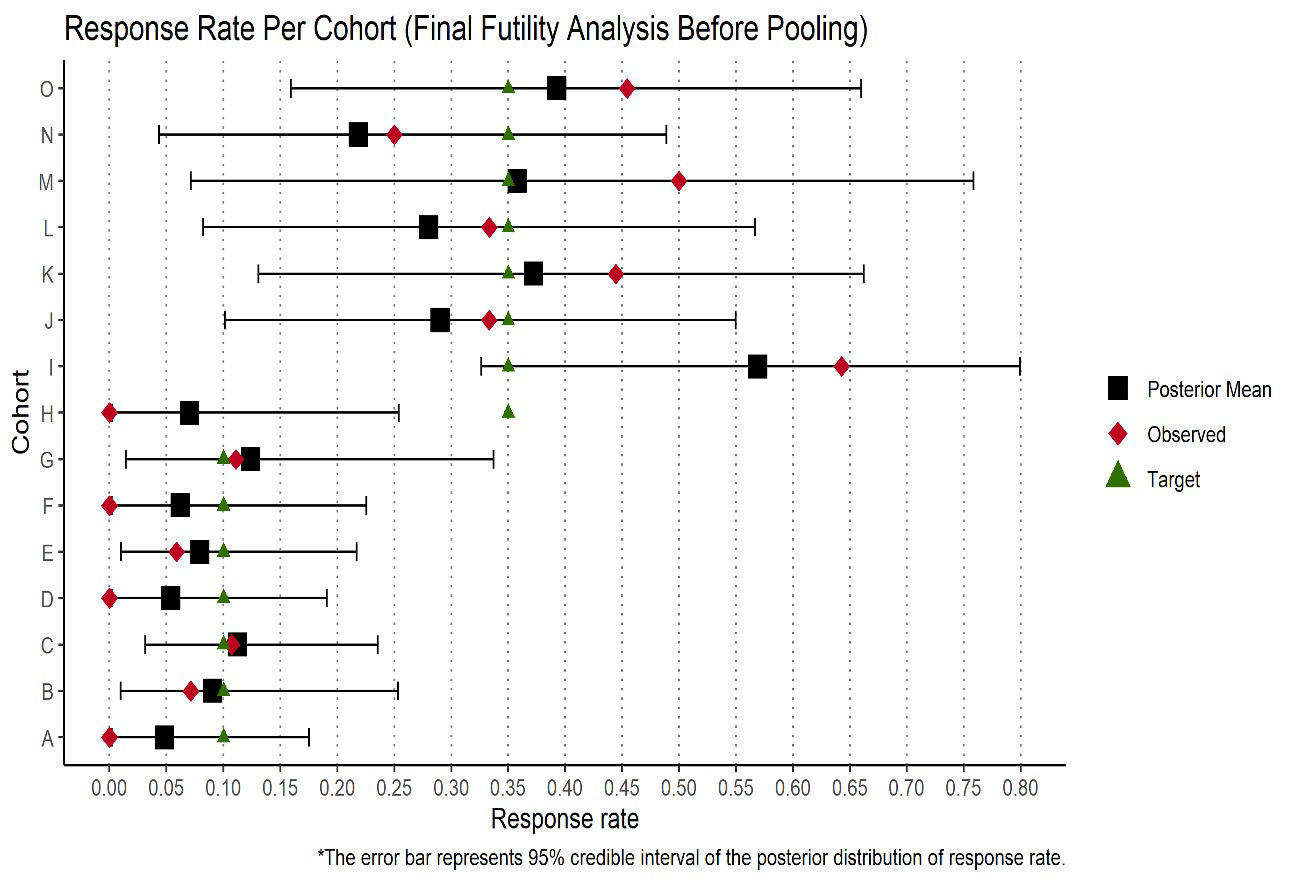
saveRDS(df_jandj,file="xxx.rds")Analysis2.R.We selected a scenario half-half other 35 below to visualize the futility analysis using bayesian methods. The figures were generated in 1st IA, 2nd IA and final futility analysis before pooling.
The numbers below represents the target response rate for each cohort.
0.10 0.10 0.10 0.10 0.10 0.10 0.10 0.35 0.35 0.35 0.35 0.35 0.35 0.35 0.35
The sample code for the figures below is stored as PosteriorPlotExample.R.
1st Interim Futility Analysis
2nd Interim Futility Analysis
Final Futility Analysis Before Pooling
#######################################
## import library
#######################################
library(ggplot2)
library(dplyr)
library(tidyr)
library(gridExtra)
library(reshape)
library(invgamma)
library(bayesCT)
library(rjags)
library(tibble)
library(parallel)
library(doParallel)
library(rlist)
#######################################
## utility function
#######################################
summary_cohort <- function(data) {
result <-
data %>% group_by(tumor_group_assign) %>% summarise(n = n(), responders = sum(response))
df <- as.data.frame(result)
df <- df %>% mutate(prop=responders/n)
return(df)
}
# function to remove key from a list
remove_from_list <- function(data,removelst){
len <- length(removelst)
texta <- "within(data, rm("
textb <- "))"
if (length(removelst) != 0){
for (i in 1:len){
data <- eval(parse(text=paste0(texta,removelst[i],textb)))
}
}
return(data)
}
# update tumor prop weight
update_tumor_prop <- function(source,stopcohort){
# source: source list
# stopcohort: vec, the cohorts will be stopped
prop_tumor_lst_2 <- remove_from_list(source,stopcohort)
prop_tumor_lst_2 <- as.list(unlist(prop_tumor_lst_2)/sum(unlist(prop_tumor_lst_2)))
return(prop_tumor_lst_2)
}
##############################################################################
# observed issues:
# 1. e.g. stop cohort B in IA1 due to low posterior prob,
# but high in IA2. How to decide? since IA is futility IA, I think it is
# more reasonable to stop cohort B for all incoming recruitment.
#
##############################################################################
#######################################
## import functions
#######################################
trialsingle <- function(simindex,
IA,
accrate,
ss,
datacut,
multiplier,
tumorprop,
trueorr,
trdur,
cap,
norm_a=-2.19,
norm_b=4,
mean_tau=2,
weight_tau=0.75,
mcmc_seed=100,
mcmc_iter=5000,
futprob=0.25,
probfut=0.40,
minsub=5,
succprob=0.25,
probsucc=0.8,
p0=0.15,
alpha=0.05){
# simindex: the index of sim trial
# IA: indicate which stage of IA
# accrate: float, accrual rate during the trial
# ss: integer, total sample size in the whole trial
# datacut: vec of integer, the total sample size in each IA, e.g. c(50,120,200)
# tumorprop: list, the prevalence of tumor type
# trueorr: list, the orr for binomial distribution
# multiplier: float, give an upper limit for sample size, typically x1.5
# detect the number of cores for parallel computing
# n.cores <- detectCores()
# #################
# general setting
# #################
tumor_type_overall <- LETTERS[1:length(tumorprop)] # generate tumor type
tumorprop.lst <- setNames(as.list(tumorprop),tumor_type_overall)
tumororr.lst <- setNames(as.list(trueorr),tumor_type_overall)
tumor.cap.index <- setNames(as.list(rep(NA,length(tumorprop))),tumor_type_overall) # locate where to stop recruitment due to cap
########################
# simulate 1st interim
########################
# generate simulated data which is larger than the sample size
n1sample <- multiplier*ss
# initiate data container & generate random numbers
simindex_vec <- rep(simindex,n1sample)
id <- as.integer(seq(from=1,to=n1sample,by=1)) # subject id
enroll_pattern <- enrollment(param = accrate, N_total = n1sample) # enroll pattern
complete.tr <- enroll_pattern + trdur
tumor_group_assign <- sample(tumor_type_overall, size = n1sample, replace = TRUE, prob = tumorprop)
IA.flag <- rep(FALSE,n1sample)
keep.flag <- rep(FALSE,n1sample) # indicate if this record is kept
response <- rep(FALSE,n1sample) # indicate if this record is kept
# data manipulate
IA1.df <- data.frame(simindex_vec,
id,
enroll_pattern,
complete.tr,
tumor_group_assign,
response,
IA.flag,
keep.flag)
# initiate the sample size for IA1
IA1.ss <- 0
tumor.counter <- setNames(as.list(rep(0,length(tumorprop))),tumor_type_overall)
stopflag <- FALSE
for (i in 1:nrow(IA1.df)){
# search tumor type
i.tumor <- IA1.df[i,"tumor_group_assign"]
# check if the tumor type exceeds the cap
if (tumor.counter[[i.tumor]] <= cap-1){
i.tumor.orr <- tumororr.lst[[i.tumor]]
IA1.df[i,"response"] <- rbinom(1,1,i.tumor.orr)
# indicate if this record go to IA 1
if (IA1.ss <= (datacut[1]-1)){
IA1.df[i,"IA.flag"] <- TRUE
IA1.df[i,"keep.flag"] <- TRUE # whether records are kept in dataset
IA1.maxtrassess <- IA1.df[i,"complete.tr"]
} else if ((IA1.ss > datacut[1]-1) & IA1.df[i,"enroll_pattern"] <= IA1.maxtrassess){
IA1.df[i,"keep.flag"] <- TRUE
} else {
stopflag <- TRUE
}
} else {
next
}
if (stopflag == FALSE) {
# count the sample size for each tumor type
tumor.counter[[i.tumor]] <- tumor.counter[[i.tumor]] +1
# sum up to check the sample size
IA1.ss <- sum(unlist(tumor.counter))
} else {
# record the final row index
IA1.rowindex <- i
break
}
}
# output data
IA1.df <- IA1.df %>%
mutate(IA = ifelse(IA.flag==TRUE,
1,
ifelse(IA.flag==FALSE & keep.flag==TRUE,2,NA)))
# a name list of no-go cohort due to CAP
cap.nogo <- names(unlist(tumor.counter)[unlist(tumor.counter)>=cap])
###################################
# Bayes IA 1 - futility analysis
###################################
# set the parameter for normal
a = norm_a
b = norm_b
# set the parameter for inverse gamma
invg_a <- weight_tau / 2
invg_b <- (mean_tau ^ 2) * weight_tau / 2
# subset data for analysis
adam <- IA1.df %>%
filter(IA <= 1 & (!is.na(IA)))
summary_adam <- summary_cohort(adam)
# set burn in
burn.in = 2000
# DEFINE the BH model
bayes_model <- "model{
# Likelihood model for PiG
for (i in 1:length(K)){
K[i] ~ dbin(orr[i],n[i])
orr[i] <- exp(thetag[i])/(1+exp(thetag[i]))
}
for (i in 1:length(K)){
thetag[i] ~ dnorm(mu,tau2)
}
# Prior model for thetag,mu,tau2
mu ~ dnorm(a, b)
# sigma2 <- 1/tau2
## inverse gamma
tau2 ~ dgamma(alpha,beta)
}"
bayes_jags_IA <- jags.model(
textConnection(bayes_model),
data = list(
a = a,
b = b,
K = summary_adam$responders,
alpha = invg_a,
beta = invg_b,
n = summary_adam$n
),
inits = list(.RNG.name = "base::Wichmann-Hill", .RNG.seed = mcmc_seed),
quiet = TRUE
)
# mcmc to generate the posterior
update(bayes_jags_IA, burn.in)
bayes_sim_IA <-
coda.samples(model = bayes_jags_IA,
variable.names = c("orr"),
n.iter = mcmc_iter)
# Store the chains in a matrix -- source of posterior of orr
bayes_chains_IA <- bayes_sim_IA[[1]]
colnames(bayes_chains_IA) <- summary_adam$tumor_group_assign
# futility
futility_decision_IA <-
apply(bayes_chains_IA > futprob, MARGIN = 2, FUN = mean)
### decide which cohort should be stopped due to posterior
# bayesian stop due to futility: posterior < probfut and min subjects >= minsub
stop_bayes_post1 <-
intersect(summary_adam$tumor_group_assign[which(futility_decision_IA <
probfut)],
(summary_adam %>% filter(n >= minsub))$tumor_group_assign)
# overall: which cohorts should be stopped
overall.stop <- union(cap.nogo, stop_bayes_post1)
########################
# simulate 2nd interim
########################
stopflag <- FALSE
for (j in IA1.rowindex:nrow(IA1.df)){
# search tumor type
i.tumor <- IA1.df[j,"tumor_group_assign"]
if (i.tumor %in% overall.stop){
next
}
# check if the tumor type exceeds the cap
if (tumor.counter[[i.tumor]] <= cap-1){
i.tumor.orr <- tumororr.lst[[i.tumor]]
IA1.df[j,"response"] <- rbinom(1,1,i.tumor.orr)
# indicate if this record go to IA 1
if (IA1.ss <= (datacut[2]-1)){
IA1.df[j,"IA.flag"] <- TRUE
IA1.df[j,"keep.flag"] <- TRUE # whether records are kept in dataset
IA1.maxtrassess <- IA1.df[j,"complete.tr"]
IA1.df[j,"IA"] <- 2
} else if ((IA1.ss > datacut[2]-1) & IA1.df[j,"enroll_pattern"] <= IA1.maxtrassess){
IA1.df[j,"keep.flag"] <- TRUE
IA1.df[j,"IA"] <- 3
} else {
stopflag <- TRUE
}
} else {
next
}
if (stopflag == FALSE) {
# count the sample size for each tumor type
tumor.counter[[i.tumor]] <- tumor.counter[[i.tumor]] +1
# sum up to check the sample size
IA1.ss <- sum(unlist(tumor.counter))
} else {
# record the final row index
IA2.rowindex <- j
break
}
}
# a name list of no-go cohort due to CAP
cap.nogo <- names(unlist(tumor.counter)[unlist(tumor.counter)>=cap])
###################################
# Bayes IA 2 - futility analysis
###################################
# subset data for analysis
adam <- IA1.df %>%
filter(IA <= 2 & (!is.na(IA)))
summary_adam <- summary_cohort(adam)
# mcmc to generate the posterior
bayes_jags_IA <- jags.model(
textConnection(bayes_model),
data = list(
a = a,
b = b,
K = summary_adam$responders,
alpha = invg_a,
beta = invg_b,
n = summary_adam$n
),
inits = list(.RNG.name = "base::Wichmann-Hill", .RNG.seed = mcmc_seed),
quiet = TRUE
)
update(bayes_jags_IA, burn.in)
bayes_sim_IA <-
coda.samples(model = bayes_jags_IA,
variable.names = c("orr"),
n.iter = mcmc_iter)
# Store the chains in a matrix -- source of posterior of orr
bayes_chains_IA <- bayes_sim_IA[[1]]
colnames(bayes_chains_IA) <- summary_adam$tumor_group_assign
# futility
futility_decision_IA <-
apply(bayes_chains_IA > futprob, MARGIN = 2, FUN = mean)
### decide which cohort should be stopped due to posterior
# bayesian stop due to futility: posterior < probfut and min subjects >= minsub
stop_bayes_post2 <-
intersect(summary_adam$tumor_group_assign[which(futility_decision_IA <
probfut)],
(summary_adam %>% filter(n >= minsub))$tumor_group_assign)
stop.bayes <- unique(union(stop_bayes_post1,stop_bayes_post2))
# overall: which cohorts should be stopped
overall.stop <- union(cap.nogo, stop.bayes)
########################
# simulate finalinterim
########################
stopflag <- FALSE
for (m in IA2.rowindex:nrow(IA1.df)){
# search tumor type
i.tumor <- IA1.df[m,"tumor_group_assign"]
if (i.tumor %in% overall.stop){
next
}
# check if the tumor type exceeds the cap
if (tumor.counter[[i.tumor]] <= cap-1){
i.tumor.orr <- tumororr.lst[[i.tumor]]
IA1.df[m,"response"] <- rbinom(1,1,i.tumor.orr)
# indicate if this record go to IA 1
if (IA1.ss <= (datacut[3]-1)){
IA1.df[m,"IA.flag"] <- TRUE
IA1.df[m,"keep.flag"] <- TRUE # whether records are kept in dataset
IA1.maxtrassess <- IA1.df[m,"complete.tr"]
IA1.df[m,"IA"] <- 3
} else {
stopflag <- TRUE
}
} else {
next
}
if (stopflag == FALSE) {
# count the sample size for each tumor type
tumor.counter[[i.tumor]] <- tumor.counter[[i.tumor]] +1
# sum up to check the sample size
IA1.ss <- sum(unlist(tumor.counter))
} else {
# record the final row index
IA3.rowindex <- m
break
}
}
###################################
# Bayes Final
###################################
# subset data for analysis
adam <- IA1.df %>%
filter(IA <= 3 & (!is.na(IA)))
summary_adam <- summary_cohort(adam)
# mcmc to generate the posterior
bayes_jags_IA <- jags.model(
textConnection(bayes_model),
data = list(
a = a,
b = b,
K = summary_adam$responders,
alpha = invg_a,
beta = invg_b,
n = summary_adam$n
),
inits = list(.RNG.name = "base::Wichmann-Hill", .RNG.seed = mcmc_seed),
quiet = TRUE
)
update(bayes_jags_IA, burn.in)
bayes_sim_IA <-
coda.samples(model = bayes_jags_IA,
variable.names = c("orr"),
n.iter = mcmc_iter)
# Store the chains in a matrix -- source of posterior of orr
bayes_chains_IA <- bayes_sim_IA[[1]]
colnames(bayes_chains_IA) <- summary_adam$tumor_group_assign
###################################
# Bayes Final - futility analysis
###################################
# futility
futility_decision_IA <-
apply(bayes_chains_IA > futprob, MARGIN = 2, FUN = mean)
### decide which cohort should be stopped due to posterior
# bayesian stop due to futility: posterior < probfut and min subjects >= minsub
stop_bayes_post3 <-
intersect(summary_adam$tumor_group_assign[which(futility_decision_IA <
probfut)],
(summary_adam %>% filter(n >= minsub))$tumor_group_assign)
stop.bayes <- unique(union(stop.bayes,stop_bayes_post3)) # will not pool
############################################
# Bayes Final - Bayesian efficacy analysis
############################################
## single cohort success
by_cohort_decision_FA <- apply(bayes_chains_IA>succprob,MARGIN = 2,FUN=mean)
single_cohort_succ <- summary_adam$tumor_group_assign[which(by_cohort_decision_FA>probsucc)]
single_success <- ifelse(length(single_cohort_succ)>0,TRUE,FALSE)
## get FWER
nonactive <- names(tumororr.lst[tumororr.lst<=0.15]) # get the non-active histology
if (length(single_cohort_succ)>0){
if(sum(is.element(single_cohort_succ,nonactive))>=1){
fwerflag <- TRUE
} else {
fwerflag <- FALSE
}
} else {
fwerflag <- FALSE
}
## overall success by pooling via exact binomial test: H0 p<=p0, H1 p>p0
pooldat <- summary_adam %>% filter(!tumor_group_assign %in% stop.bayes)
pooltotalresp <- sum(pooldat$responders)
poolsamplesize <- sum(pooldat$n)
poolresprate <- round(pooltotalresp/poolsamplesize,3)
if (poolsamplesize>0){
poolingtest <- ifelse(as.numeric(binom.test(x=pooltotalresp,n=poolsamplesize,p=p0,alternative = "greater")$p.value <= (alpha) ),TRUE,FALSE)
} else {
poolingtest <- FALSE
}
overalltotalresp <- sum(summary_adam$responders)
overallsamplesize <- sum(summary_adam$n)
overallresprate <- round(overalltotalresp/overallsamplesize,3)
# FPR for pooled analysis
# re-calculate tumor proportion (normalizing the weight)
not_appear_insim <- names(remove_from_list(data=tumorprop.lst,removelst = summary_adam$tumor_group_assign))
stop_cohort <- unique(union(not_appear_insim,stop.bayes))
norm_tumorprop_weight <- update_tumor_prop(source=tumorprop.lst,stopcohort=stop_cohort)
## initial the flag for mixing non-active
mixnonactflag <- FALSE
if (poolsamplesize != 0){
norm_tumorprop_weight.df <- data.frame(norm_tumorprop_weight)
# pooldat.subset <- pooldat[,c("tumor_group_assign","prop")]
# pooldat.subset2 <- pooldat.subset %>%
# pivot_wider(names_from = tumor_group_assign, values_from = prop) %>%
# as.data.frame()
pooldat.subset2 <- data.frame(remove_from_list(data = tumororr.lst,removelst = stop_cohort))
mixnonactflag <- ifelse(sum(pooldat.subset2[1,]<=0.15)>=1 & poolingtest == TRUE,TRUE,FALSE)
poolorr <- rbind(norm_tumorprop_weight.df,pooldat.subset2)
weighted.orr <- sum(poolorr[1,]*poolorr[2,])
if (poolingtest == TRUE & (weighted.orr-0.15)<=1e-3){
fprflag <- TRUE
} else {
fprflag <- FALSE
}
} else {
fprflag <- FALSE
}
# record those cohorts enter pooling analysis
tumor.futstop <- setNames(as.list(rep(0,length(tumor_type_overall))),tumor_type_overall)
for (item in stop.bayes){
tumor.futstop[[item]] <- tumor.futstop[[item]]+1
}
# duration
maxdur <- max(adam$enroll_pattern)
# efficacy FA output
index <- min(adam$simindex_vec)
df0 <- data.frame(index = index)
df1 <- t(as.data.frame(by_cohort_decision_FA>probsucc))
rownames(df1) <- c()
df2 <- data.frame(singlesucc = single_success,
poolsucc = poolingtest,
pooltotalresp = pooltotalresp,
poolsamplesize = poolsamplesize,
poolresprate = poolresprate,
overalltotalresp = overalltotalresp,
overallsamplesize = overallsamplesize,
overallresprate = overallresprate,
maxdur = maxdur,
fwer = fwerflag,
fpr = fprflag,
mixnonact = mixnonactflag)
df3 <- as.data.frame(tumor.futstop)
colnames(df3) <- paste0(colnames(df3),"_pool")
df <- cbind(df0,df1,df2,df3)
return(df)
}#####
#run
#####
source("functions2.R")
## TEST code
simindex = 1
tumorprop = c(18,18,13,13,10,5,4,4,3,2,2,1,1,1,5)*0.01
# trueorr = rep(0.15,15)
# trueorr = rep(0.25,15)
# trueorr = rep(0.35,15)
# trueorr = c(rep(0.10,7),rep(0.35,7),0.15) # use half-half other 15 settings
 trueorr = c(rep(0.10,7),rep(0.35,8)) # use half-half other 35 settings
# trueorr = c(rep(0.10,2),rep(0.15,3),0.35,rep(0.15,9)) # use Cholangio35 settings
p.target = 0.15
IA = 1
accrate = 10/7
ss = 200
datacut = c(60,130,200) # 200 is final analysis
multiplier = 3
trdur = 4*7
cap = 30
## parallel
set.seed(123)
iter = 5000
myCluster <- makeCluster(10)
registerDoParallel(myCluster)
df_jandj = foreach(it=1:iter,.combine=dplyr::bind_rows)%dopar%{
source("functions2.R")
trialsingle(simindex,
IA,
accrate,
ss,
datacut,
multiplier,
tumorprop,
trueorr,
trdur,
cap,
norm_a=-2.19,
norm_b=1/4,
mean_tau=2,
weight_tau=0.75,
mcmc_seed=100,
mcmc_iter=5000,
futprob=0.25,
probfut=0.40,
minsub=5,
succprob=0.25,
probsucc=0.8,
p0=0.15,
alpha=0.05)
}
stopCluster(myCluster)
saveRDS(df_jandj,file="df_halfhalf35.rds")#######################################
## analysis the result
#######################################
library(ggplot2)
library(rtables)
folder = "xxxx" # Set target working dir
# Start writing to an output file
df_all15 <- readRDS(file=paste0(folder,"df_all15.rds"))
df_all25 <- readRDS(file=paste0(folder,"df_all25.rds"))
df_all35 <- readRDS(file=paste0(folder,"df_all35.rds"))
df_halfhalf35 <- readRDS(file=paste0(folder,"df_halfhalf35.rds"))
df_halfhalf15 <- readRDS(file=paste0(folder,"df_halfhalf15.rds"))
df_Cholangio35 <- readRDS(file=paste0(folder,"df_Cholangio35.rds"))
write2txt <- function(name,data,file,append=FALSE){
# cohort vec
trueorr = c(rep(0.15,7),rep(0.35,8)) # use half-half other 35 settings
cohort_vec <- LETTERS[1:length(trueorr)]
cohort_vec_pool <- paste0(cohort_vec,"_pool")
if (append==FALSE){
sink(file)
cat(name,"\n", "-----------------","\n")
# single success
df1 <- data[,c(cohort_vec,"singlesucc")]
df1[is.na(df1)] <- 0
singlesucc.df <- as.data.frame(apply(df1,MARGIN = 2, mean))
print(singlesucc.df[1:(nrow(singlesucc.df)-1),,drop=FALSE])
cat(">> Ppn of success: ", singlesucc.df[nrow(singlesucc.df),1],"\n")
# overall success (by exact binom test)
# hypothesis test: h1: p>p0=0.35
cat(">> Power: ",mean(data[,c("poolsucc")]),"\n")
# fwer for single success
cat(">> FWER: ",mean(data[,c("fwer")]),"\n")
# fpr for pool
cat(">> FPR: ",mean(data[,c("fpr")]),"\n")
# mixing non-active
cat(">> Mixing non-active: ",mean(data[,c("mixnonact")]),"\n")
# mean duration
cat(">> mean duration (days): ",mean(data[,c("maxdur")]),"\n")
sink()
} else {
sink(file,append = TRUE)
cat("\n",name,"\n", "-----------------","\n")
# single success
df1 <- data[,c(cohort_vec,"singlesucc")]
df1[is.na(df1)] <- 0
singlesucc.df <- as.data.frame(apply(df1,MARGIN = 2, mean))
print(singlesucc.df[1:(nrow(singlesucc.df)-1),,drop=FALSE])
cat(">> Ppn of success: ", singlesucc.df[nrow(singlesucc.df),1],"\n")
# overall success (by exact binom test)
# hypothesis test: h1: p>p0=0.35
cat(">> Power: ",mean(data[,c("poolsucc")]),"\n")
# fwer for single success
cat(">> FWER: ",mean(data[,c("fwer")]),"\n")
# fpr for pool
cat(">> FPR: ",mean(data[,c("fpr")]),"\n")
# mixing non-active
cat(">> Mixing non-active: ",mean(data[,c("mixnonact")]),"\n")
# mean duration
cat(">> mean duration (days): ",mean(data[,c("maxdur")]),"\n")
sink()
}
}
folder = "xxxx" # Set target working dir
write2txt(name="df_all15",data=df_all15,file = paste0(folder,"allscen.txt"))
write2txt(name="df_all35",data=df_all35,file = paste0(folder,"allscen.txt"),append = TRUE)
write2txt(name="df_all25",data=df_all25,file = paste0(folder,"allscen.txt"),append = TRUE)
write2txt(name="df_halfhalf35",data=df_halfhalf35,file = paste0(folder,"allscen.txt"),append = TRUE)
write2txt(name="df_halfhalf15",data=df_halfhalf15,file = paste0(folder,"allscen.txt"),append = TRUE)
write2txt(name="df_Cholangio35",data=df_Cholangio35,file = paste0(folder,"allscen.txt"),append = TRUE)
# selection power plot
df2 <- df_jandj[cohort_vec_pool]
selection_power1 <- length(cohort_vec_pool)-apply(df2,MARGIN = 1,sum)
selection_power1_df <- as.data.frame(table(selection_power1))
selection_power1_df <- selection_power1_df %>%
mutate(type=paste0(">=",as.character(selection_power1)),sum=0)
for (rowi in 1:nrow(selection_power1_df)){
selection_power1_df[rowi,"sum"] <- sum(selection_power1_df$Freq[rowi:nrow(selection_power1_df)])
}
selection_power1_df <- selection_power1_df %>%
mutate(perc=sum/nrow(df_jandj))
p <- ggplot(data=selection_power1_df,aes(x=type,y=perc)) +
geom_bar(stat = "identity",width=0.2) +
scale_x_discrete(limits=selection_power1_df$type) +
geom_text(aes(label = perc), vjust = -0.3) +
theme_bw()
p
###########################
## without cPR/cCR
###########################
df_all25_noconfirm <- readRDS(file="df_all25_noconfirm.rds")
write2txt(name="df_all25_noconfirm",data=df_all25_noconfirm,file = paste0(folder,"df_all25_noconfirm.txt"))
###############################################
## all 25 and futility stop prob = 0.34
###############################################
df_all25_probfut34 <- readRDS(file="df_all25_probfut34.rds")
write2txt(name="df_all25_probfut34",data=df_all25_probfut34,file = paste0(folder,"df_all25_probfut34.txt"))
###############################################
## all 25 and futility stop prob = 0.30
###############################################
df_all25_probfut30 <- readRDS(file="df_all25_probfut30.rds")
write2txt(name="df_all25_probfut30",data=df_all25_probfut30,file = paste0(folder,"df_all25_probfut30.txt"))